Delivery Rate is important in email marketing because it shows how many emails actually reach recipients’ inboxes. A high delivery rate means your list is clean, your sender reputation is strong, and your messages have a real chance to be opened, clicked, and converted. Without good deliverability, your entire email campaign fails before it even starts.
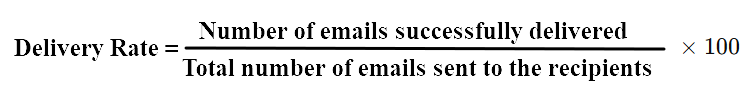
The formula for calculating email Delivery Rate is:
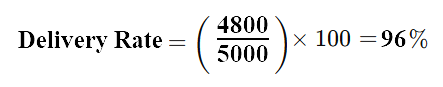
For example, you send 5,000 emails in a campaign. Out of those, 4,800 emails were successfully delivered (they didn’t bounce). So, your Delivery Rate should be 96%, meaning 96% of your emails reached recipients’ inboxes successfully as shown in the calculation below:
This 96% is considered a good Delivery Rate for email campaigns.
Open rate is a key email marketing metric. It shows the percentage of recipients who opened your email. A higher open rate means more people are seeing your message.
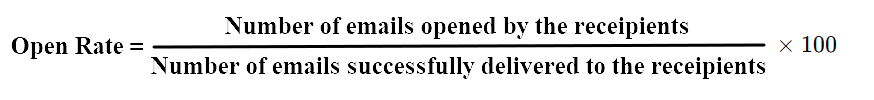
The formula for calculating Open Rate is:
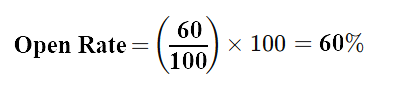
In this example, suppose if we sent emails to 200 subscribers, 100 of them were successfully delivered, and 60 of them were opened, the Open Rate calculation will be:
Here, Open Rate is 60%. Higher Open Rate generally indicates that your audience is interested in the content of your emails, while a lower Open Rate may suggest the need for adjustments in your email strategy or email content.
Click rate is one of the most important metrics in email marketing because it directly measures engagement and interest. It tells you how many recipients not only opened your email but mainly interacted with its content by clicking a link, button, or Call-to-Action (CTA), showing overall engagement with the campaign.
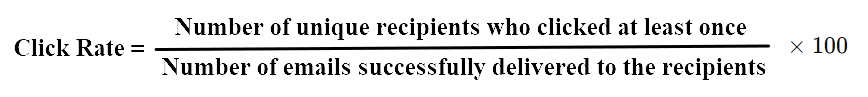
The formula for calculating email Click Rate is:
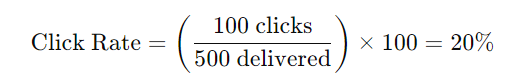
For example, 500 emails were successfully delivered to the recipients, and 100 unique recipients clicked at least one link in the email. So the Click Rate calculation will be:
Here the Click Rate is 20% which indicates the overall interaction with link in your email. A higher click rate indicates that your content and call-to-action are engaging.
The Click-Through Rate (CTR) is a key performance metric in email marketing that measures how effectively your email content drives recipients to take action — typically by clicking a link, button, or call-to-action (CTA).
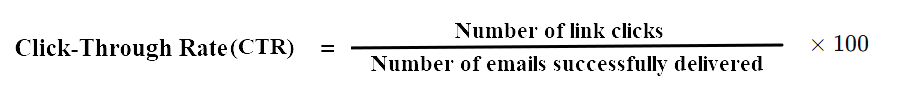
The formula for calculating email Click-Through Rate (CTR) is:
Note: Number of clicked links means Total number of clicked links including multiple clicks by the same recipient.
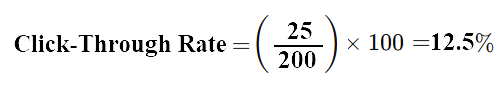
For example, 200 emails were successfully delivered, and 25 were link clicks, then the Click-Through Rate calculation will be:
Here, the Click-Through Rate is 12.5% which shows how engaging your content is. A higher CTR means more recipients are interacting with your email.
Click-to-Open Rate (CTOR) is important in email marketing because it tells you whether your content actually engages readers and motivates them to take action. It helps you improve email design, messaging, and overall engagement quality. It mainly shows how effective your email content and call-to-action (CTA) are after the email is opened.
The formula for calculating email Click-to-Open Rate (CTOR) is:
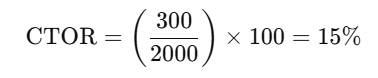
For example, if the recipients opened 2,000 emails and 300 is the number of unique recipients who clicked at least one link, then the calculation for CTOR will be:
This shows your Click-to-Open Rate is 15%. This reflects how engaging and relevant your content is to the audience.
Bounce Rate is important in email marketing because it shows how many emails failed to reach recipients. A high Bounce Rate hurts your sender reputation, reduces deliverability, and signals poor list quality. Keeping it low ensures more emails land in inboxes and protects your email campaign performance.
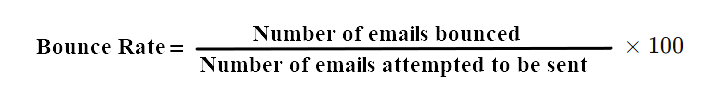
The formula for calculating email Bounce Rate is:
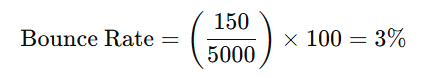
For example, 5,000 emails are attempted to be sent in which 150 emails were bounced. So the Bounce Rate calculation will be:
This shows your Bounce Rate is 3%, which is slightly above the ideal benchmark. This may suggest email hygiene issues or invalid email addresses that need attention.
Complaint rate is important in email marketing because it shows how many recipients mark your emails as spam. A high complaint rate damages your sender reputation, reduces deliverability, and can lead to your emails being blocked or blacklisted. Keeping it low ensures better inbox placement and protects your brand’s credibility.
The formula for calculating email Complaint Rate is:
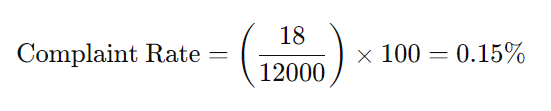
For example, there are 12000 successfully delivered emails but 18 recipients marked the email as spam or complained. So the Complaint Rate calculation will be:
Your Complaint Rate is 0.15%. Since the industry benchmark is typically below 0.1%, this is slightly high and could affect your sender reputation if not addressed.
A 0.15% Complaint Rate is slightly above the ideal threshold (0.1%) and may negatively affect deliverability. If this is the case then you must improve email content and correct target audience can help reduce complaints.
Unsubscribe Rate is important in email marketing because it shows how many people no longer want to receive your emails. A high rate can indicate poor content, irrelevant targeting, or too frequent messaging which indicates that you need to adjust your email strategy to retain and engage your audience.
The formula for calculating email Unsubscribe Rate is:
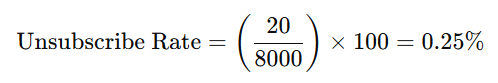
For example, 8000 emails were successfully delivered to recipients and 20 recipients unsubscribed from the mailing list after receiving emails. So the Unsubscribe rate calculation will be:
As we can see here, Unsubscribe Rate is 0.25% only, which is within the typical industry range (0.2%–0.5%). If this number increases over time, it may be a sign to review your content, frequency, or audience targeting.
Failure Rate is important in email marketing because it shows how many emails weren’t delivered. A high failure rate can harm your sender reputation, reduce deliverability, and signal poor list quality and directly impacting campaign success.
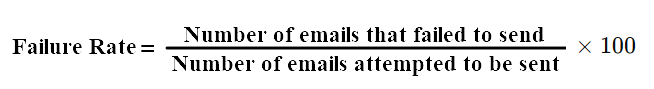
The formula for calculating email Failure Rate is:
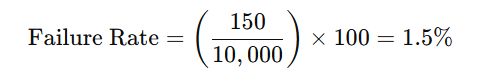
For example, 10,000 emails are being attempted to be sent in which 150 emails failed to send due to technical or server issues. So the Failure Rate calculation is:
Here, the Failure Rate is 1.5%, which may be slightly high depending on industry standards. Ideally, failure rates should remain below 1% to ensure healthy email practices and maintain good deliverability.
If your click rate is not recorded, it means MailBluster is not tracking clicks properly. First, check your AWS Configuration Sets in your AWS account. You can follow the Tracking and Report guide to make sure everything is set up correctly. Then, send a test email to yourself and see if the clicks are tracked.
Sometimes, click rate is not recorded because your HTML content is not supported by all email providers. This can make your click rate appear as 0% even if recipients click the links. To test, try a simple HTML link like:
<a href=”https://example.com”>Go to example.com</a>
Using the above HTML code, you can send test emails and track them to verify if click tracking is working correctly.
Suggestion: If you are sending HTML emails, ensure that your HTML code is supported by all email providers.
Recommendation: Use MailBluster Drag-and-drop editor to compose emails for better compatibility and reliable tracking.
The accuracy of open rate and click rate is the metric commonly used in email marketing to measure the effectiveness of email campaigns. While they provide valuable insights, it’s important to understand their limitations and factors that can influence their accuracy:
1. Open Rate:
Accuracy: Open rate is not always completely accurate. They are typically tracked using a small, invisible image (pixel) embedded in the email. If a recipient has images turned off in their email client or if the email client doesn’t load external images by default, the open may not be recorded.
Interpretation: An open is recorded when the tracking pixel is loaded, but it doesn’t guarantee that the recipient has read the email content. Some email clients may automatically load images, leading to false positives.
2. Click Rate:
Accuracy: Click rate is generally more accurate than open rates. They are recorded when a user clicks on a link within the email. However, some security measures, like link scanning by email clients or antivirus software, may artificially inflate click rates.
Bots and Automated Clicks: Bots or automated systems may click on links, leading to inflated click rates. This is more common in certain industries or regions.
3. Factors Affecting Accuracy:
Image Loading: If recipients disable automatic image loading in their email client, open rates may be underreported.
Link Scanning: Some security software or email clients may scan links in emails before allowing them to be opened, potentially affecting click rate accuracy.
Bots and Automation: Automated bots, web crawlers, or security systems may interact with emails, influencing both open and click rates.
4. Alternative Metrics:
Conversion Rates: To get a more comprehensive view of campaign success, consider tracking conversion rates, such as the percentage of recipients who completed a desired action after clicking on a link.
Engagement Metrics: Monitoring metrics like time spent on landing pages or interaction with specific elements can provide deeper insights into user engagement.
In conclusion, open rates and click rates offer valuable insights, but they should be interpreted cautiously, considering potential inaccuracies and external factors. It’s often helpful to use them in conjunction with other metrics for a more comprehensive understanding of your email campaign performance.
Here, we discuss how to increase the click rate in email marketing, which involves several strategies focused on improving the content, design, and targeting of your emails.
Here are some effective tactics that you can use in your email marketing:
1. Setting up DKIM, SPF, and DMARCcorrectly
DKIM: Adds a digital signature to your emails, verifying that the email has not been altered and that it truly comes from your domain.
SPF: Allows the domain owner to specify which IP addresses are authorized to send emails on behalf of the domain, helping to prevent spoofing.
DMARC: Aligns SPF and DKIM mechanisms to provide a unified policy for email validation, helping to protect against phishing and spoofing attacks.
With MailBluster’s Email Sender feature, you can easily set up DKIM, SPF, and DMARC records for your domain.
2. Create Compelling Subject Lines
Use Personalization: Use personalized email marketing strategies that include the recipient’s name or other personalized information.
Be Clear and Concise: Clearly state the value or benefit of opening the email. Use the best email opening lines to hook your audience.
Create a Sense of Urgency: Use phrases like “Limited Time Offer” or “Act Now.”
3. Optimize Email Content
Focus on Quality Content: Provide valuable and relevant information to your audience.
Use Strong CTAs: Include clear and compelling Email CTA (calls-to-action)
Keep it Short: Avoid long paragraphs; use bullet points and concise sentences.
4. Personalization and Segmentation
Segment Your Audience: Group your subscribers based on their behavior, preferences, or demographics.
Personalize Emails: Tailor content to each segment to make it more relevant.
Visual Appeal: Use high-quality Email images and a clean layout.
Clear and Clickable CTAs: Make your CTA buttons stand out and easy to click.
6. Clean your Email List
Remove Inactive Subscribers: Identify and remove inactive subscribers regularly who haven’t engaged with your emails over a specific period (e.g., 6 months).
Validate Email Addresses: Use email validation tools to check for syntax errors, domain validity, and mailbox existence.
Use Double Opt-In: Ensure new subscribers confirm their email addresses to reduce the likelihood of invalid addresses.
Implement Re-Engagement Campaigns: Attempt to re-engage inactive subscribers with targeted campaigns. If they don’t respond, consider removing them from your list.
7. Send at the Right Time
Analyze Audience: Analyze your audience’s behavior to determine the best times and days to send your emails.
Email-checking Habits: Consider time zones and typical email-checking habits of your audience.
8. Engage Your Audience
Ask Questions: Encourage replies and interaction.
Include Interactive Elements: Use polls, quizzes, or clickable images.
9. Optimize for Deliverability
Clean Your List: Regularly remove inactive subscribers to maintain a healthy email list.
Avoid Spam Triggers: Be mindful of words and phrases that might trigger spam filters.
Authenticate Your Emails: Use SPF, DKIM, and DMARC to improve deliverability.
10. Use Analytics and Feedback
Monitor Performance: Use analytics to track open rates, click rates, and conversions.
Gather Feedback: Ask your subscribers for feedback to understand what they like and dislike.
11. Leverage Behavioral Triggers
Automated Campaigns: Set up automated emails based on user behavior, such as abandoned cart reminders or follow-up emails. You can do this by setting up the email automation feature in MailBluster
Triggered Emails: Send emails triggered by specific actions, such as a purchase or a sign-up.
12. Provide Incentives
Exclusive Offers: Offer special discounts or promotions to email subscribers.
Free Resources: Provide valuable resources like e-books, guides, or templates.
By implementing these strategies, you can significantly increase your Click Rate and overall effectiveness of your email marketing campaigns.
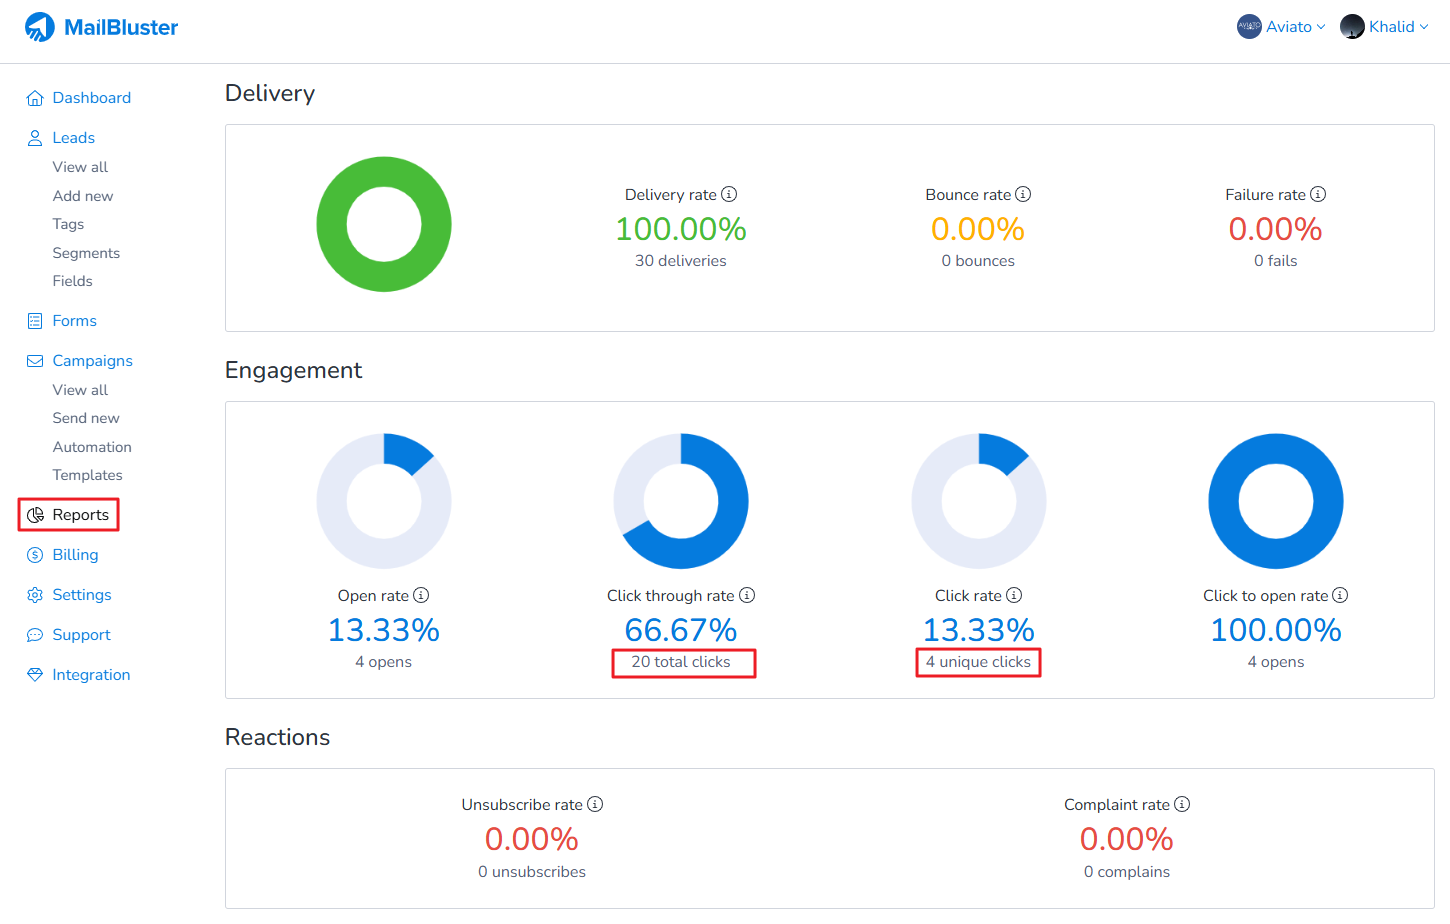
Understanding the difference between clicks and unique clicks is important when analyzing your email marketing campaign performance in MailBluster. These two metrics may sound similar, but they tell very different stories about how your audience is engaging with your emails.
Here, you’ll learn the difference between them in a simple and easy-to-understand way:
Clicks: The total number of times links were clicked, including multiple clicks by the same user.
Unique Clicks: The number of distinct users who clicked on a link, counting each user only once regardless of how many times they clicked.
Total clicks and unique clicks can be found under your Brand > Reports of each campaign.
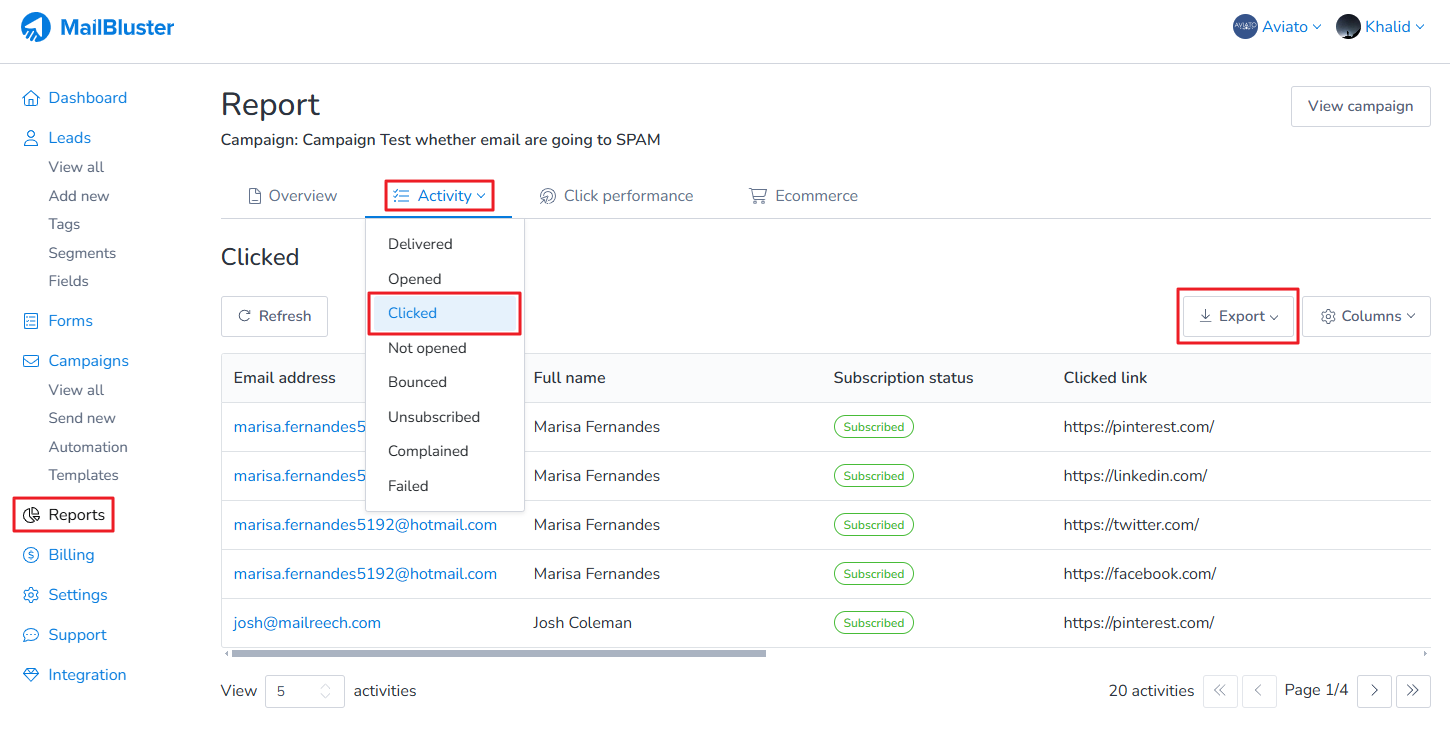
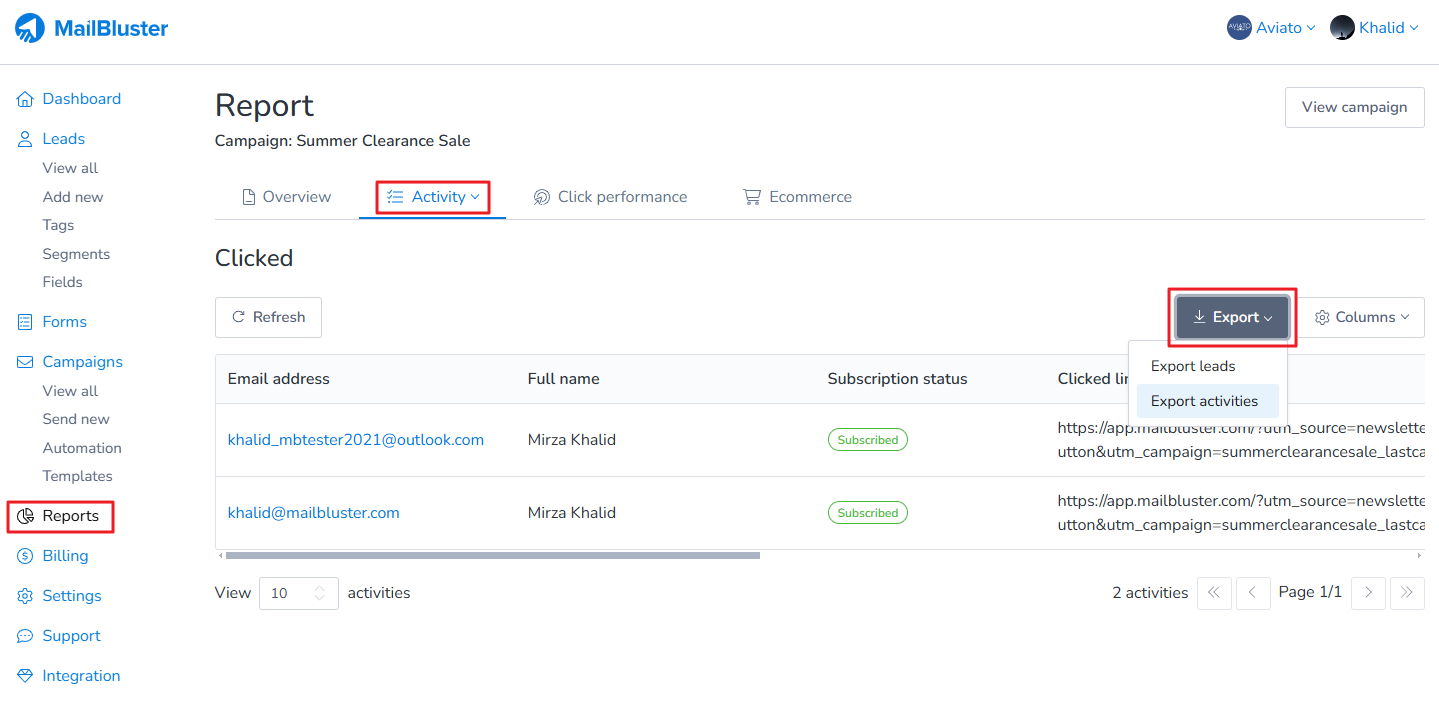
Currently, there is no option to download unique clicks directly to a CSV file. However, you can download the total clicked link activities from Reports > Activity > Clicked in your campaign report by clicking Export button, as shown below.
Here, you will learn details about the email tracking in MailBluster. MailBluster uses an SMTP provider to efficiently track all email events, providing comprehensive email tracking capabilities. MailBluster generates an overview report for each campaign, allowing you to analyze delivery rates, engagement metrics, reactions, and ecommerce data in separate sections for a clear and complete overview.
You can access all campaign reports by navigating to the Brand > Reports page. Once you select a specific campaign, you will see detailed reports for that campaign.
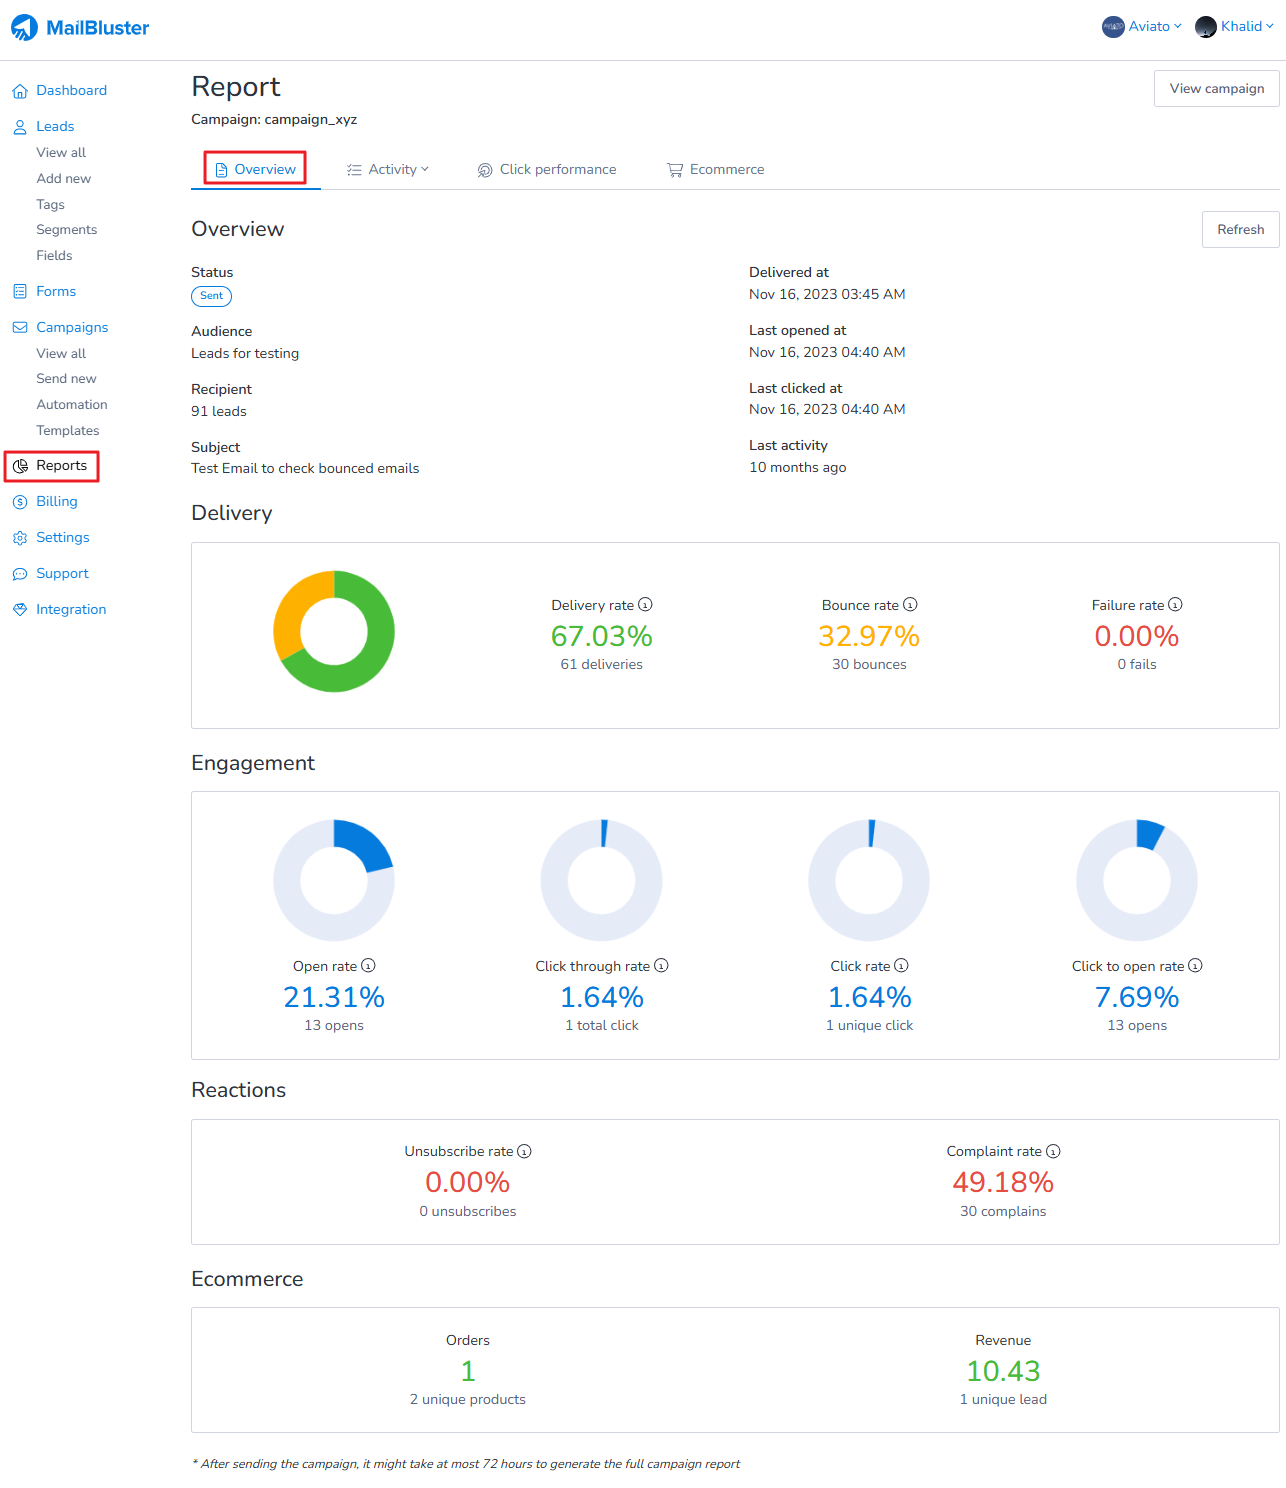
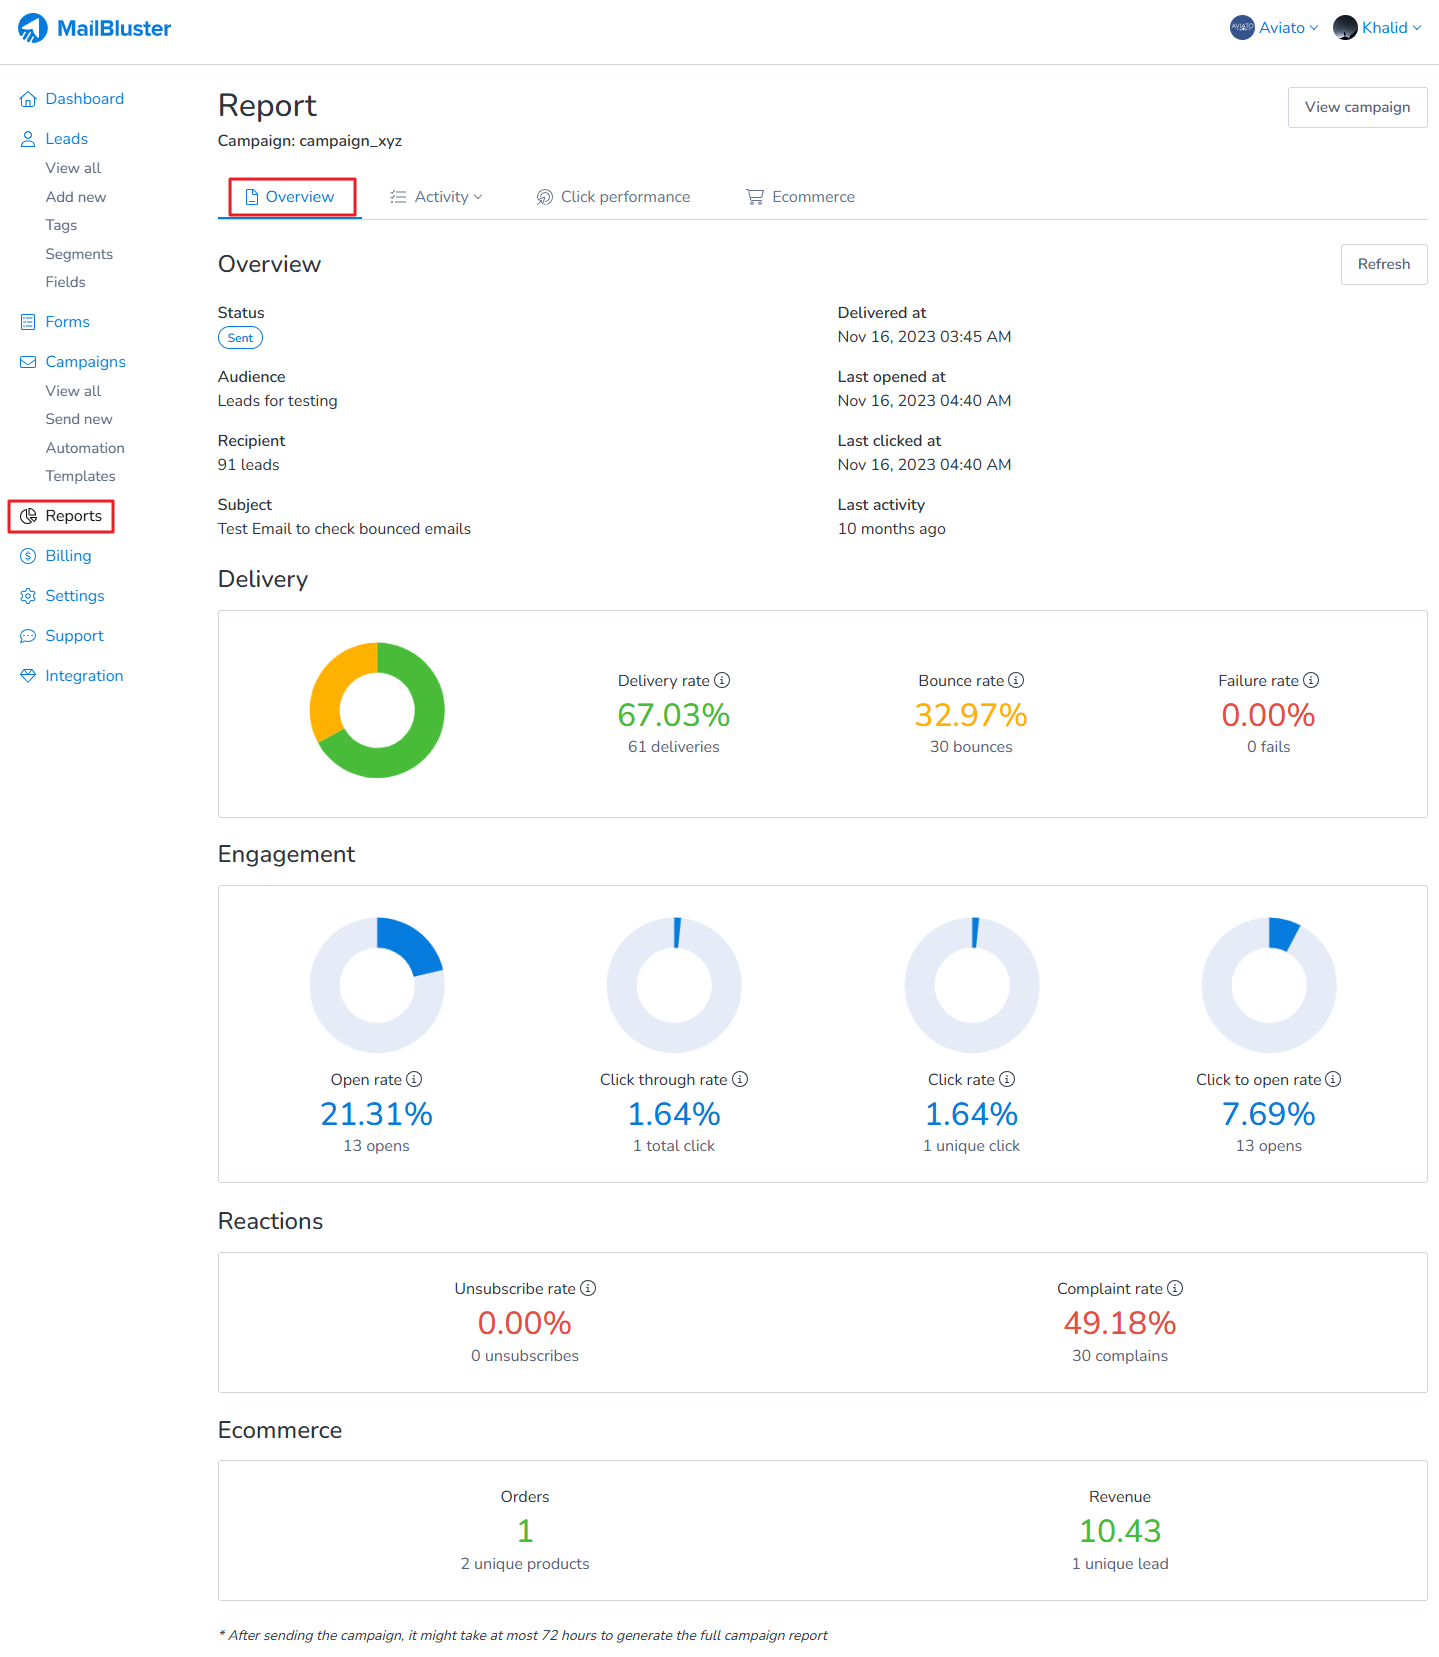
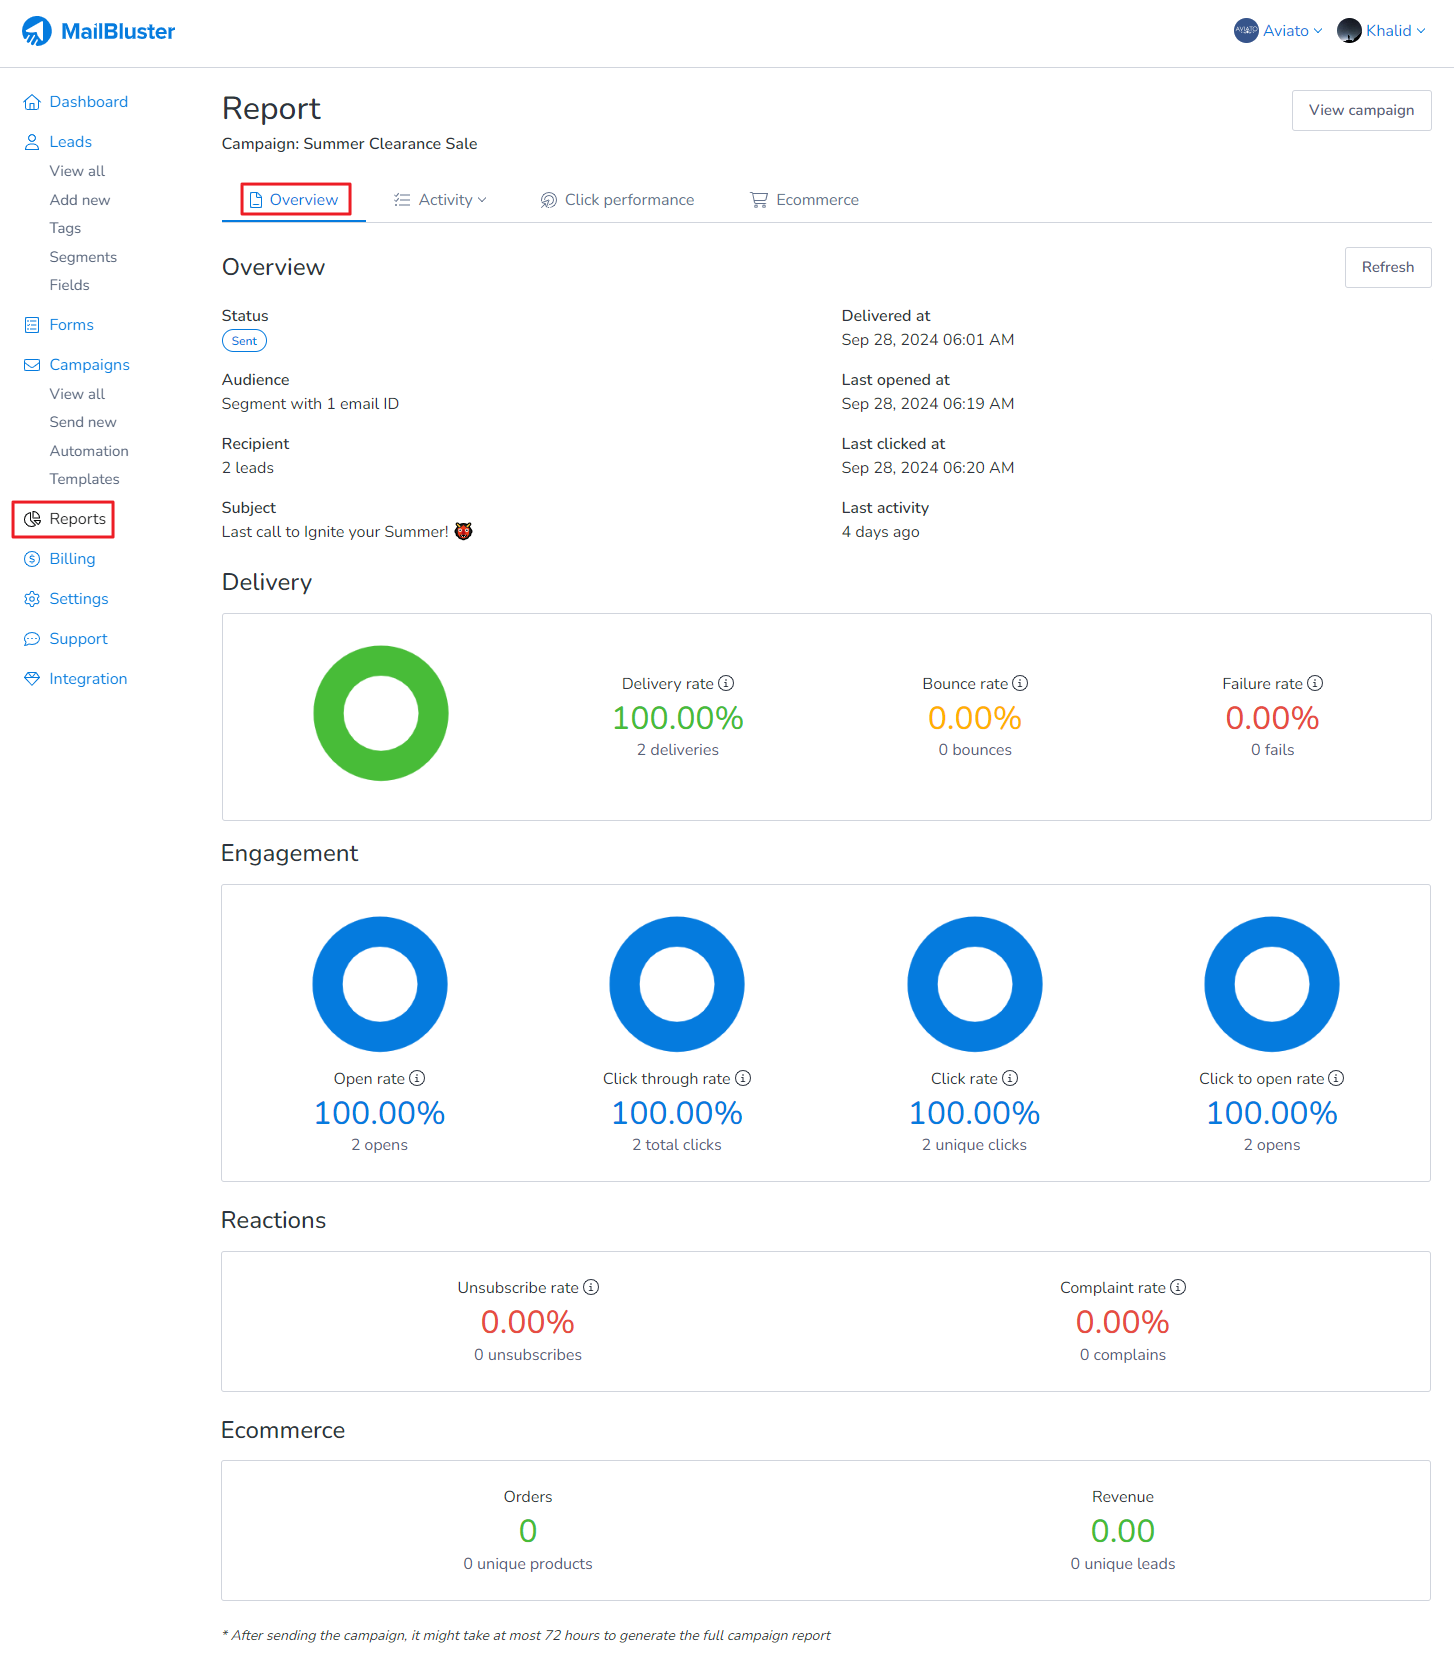
Learn about the metrics in campaign report, found under Reports > Overview for any sent campaign in MailBluster.
Here is a brief description of the terms used in the Report section of MailBluster:
Overview
Status: Displays the delivery status of your email campaign.
Audience: Indicates the name of the segment used for this campaign.
Recipients: Shows the total number of recipients (leads) in that segment.
Subject: Displays the subject of the email campaign.
Delivery
Delivery Rate: The Delivery Rate refers to the percentage of emails successfully delivered to the recipient’s mail server. This includes emails that reached the recipient’s inbox, junk folder, or promotional tab, all of which are considered delivered by the email service provider (ESP).
Bounce Rate: The Bounce Rate refers to the percentage of emails that failed to be delivered to recipients. Only hard bounces are included in this metric, as they occur when the recipient’s mail server permanently rejects the email. Soft bounces are counted only if your SMTP provider fails to deliver the email after multiple retry attempts.
Failure Rate: The Failure Rate refers to the percentage of recipients or leads who did not receive the email campaign. This includes emails that could not be delivered due to issues such as invalid email addresses or server-related problems.
Engagement
Open Rate: The Open Rate in the report shows the percentage of recipients who opened an email campaign. This metric indicates how many people opened and viewed the email’s content compared to the total number of emails delivered. Open rates provide insight into the effectiveness of subject lines, sender names, and the overall appeal of the email’s content. Higher open rates generally suggest that the subject lines and content were engaging enough to prompt recipients to open the email.
Click-Through Rate (CTR): The Click-Through Rate measures how effective the campaign is at generating total clicks relative to the total number of emails delivered, indicating campaign performance and audience targeting.
Click Rate: The Click Rate refers to the percentage of recipients who clicked on at least one link within an email. This metric measures engagement and shows the effectiveness of the content or call-to-action in the email campaign. A higher click rate generally indicates that the email content was engaging and compelling.
Click-to-Open Rate (CTOR): The Click-to-Open Rate measures how well the email content encourages clicks after the email has been opened, indicating the relevance and effectiveness of the content.
Reactions
Unsubscribe Rate: The percentage of recipients who opt out of future emails. This indicates potential dissatisfaction with the campaign or the content’s relevance to the audience.
Complaint Rate: The percentage of recipients who mark emails as spam. This may indicate issues with the content’s relevance, the quality of the email list, or the campaign’s targeting strategy.
Ecommerce
Orders: When an order is generated as a result of a campaign, it will be counted under “Orders” in the campaign report section.
Revenue: The total price of all generated orders will be recorded as “Revenue.”
In email campaign reports, it might seem unusual for the number of clicks to exceed the number of opens i.e. receive more clicks than opens, as one would typically expect that an email needs to be opened before it can be clicked. However, several reasons can explain this discrepancy which is mentioned below:
1. Image Blocking: Many email clients block images by default. Open metrics often rely on an invisible tracking pixel embedded in the email. If the images are blocked, the tracking pixel won’t load, and the open won’t be recorded, even if the recipient reads the email and clicks a link.
2. Forwarding: If an email recipient forwards the email to someone else, the forwarded recipient might click a link. The click would be recorded, but if the forwarded recipient didn’t download the tracking pixel, the open wouldn’t be recorded.
3. Link Previews: Some email clients or security software scan emails for malicious links by preloading them. This preloading can register as a click even though the email wasn’t actually opened by the recipient.
4. Bot Activity: Anti-spam bots and security software sometimes click links in emails to check for malicious content. These clicks can be recorded even if the email was never opened by a human.
5. Email Client Restrictions: Certain email clients, especially those used in enterprise environments, may block tracking pixels but not the ability to click on links, resulting in clicks being recorded without corresponding opens.
6. User Interaction Variability: Sometimes users interact with their emails in ways that bypass open tracking but still lead to clicks, such as preview panes that don’t load images but allow link interaction.
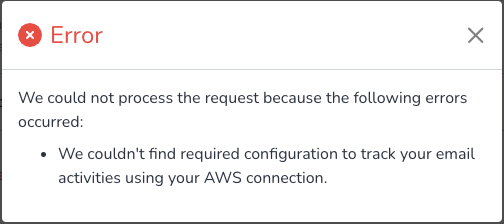
If there is any issue with Tracking and Report, you should check the configuration on your Amazon SES Dashboard. This is because many users apply custom configurations instead of the recommended settings suggested by MailBluster. As a result, MailBluster may not be able to track your email campaigns properly, and you may see an error like the one shown below.
You may notice this error message in MailBluster as well:
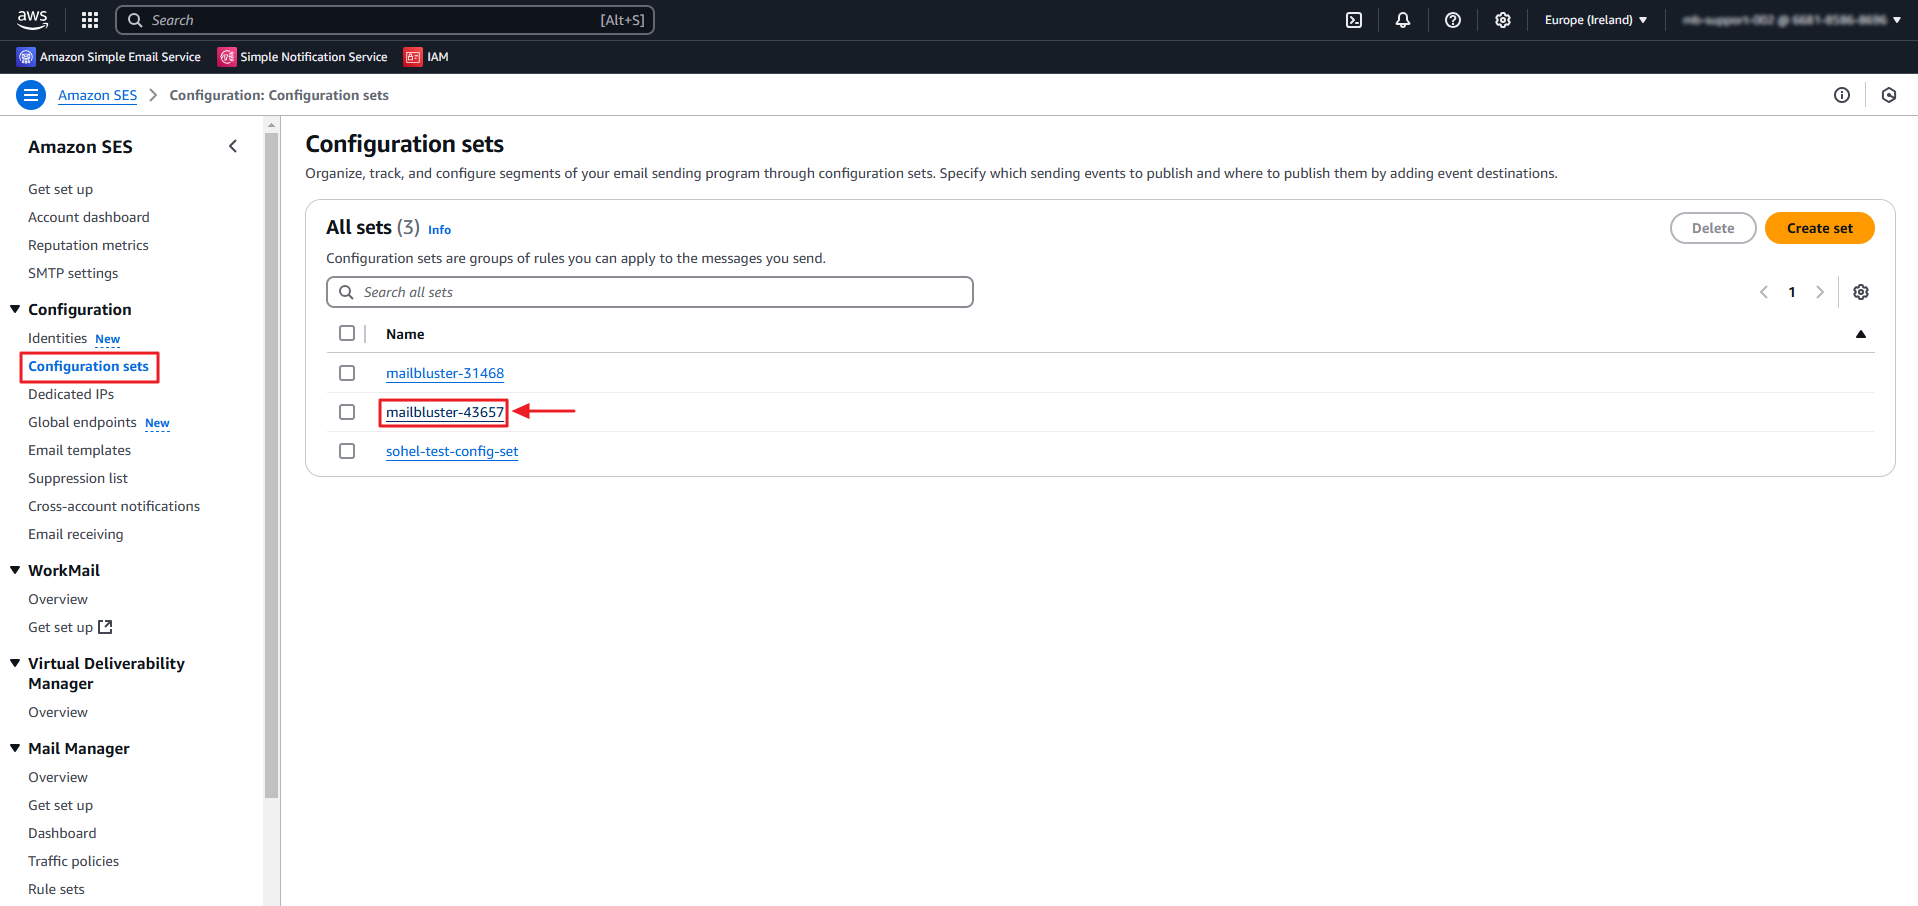
To check whether your AWS Configuration sets are set correctly, you need to sign in to your AWS Console of your AWS Account, then go to Amazon SES > Configuration sets. Click on the mailbluster-43657 (the numbers are generated randomly by AWS).
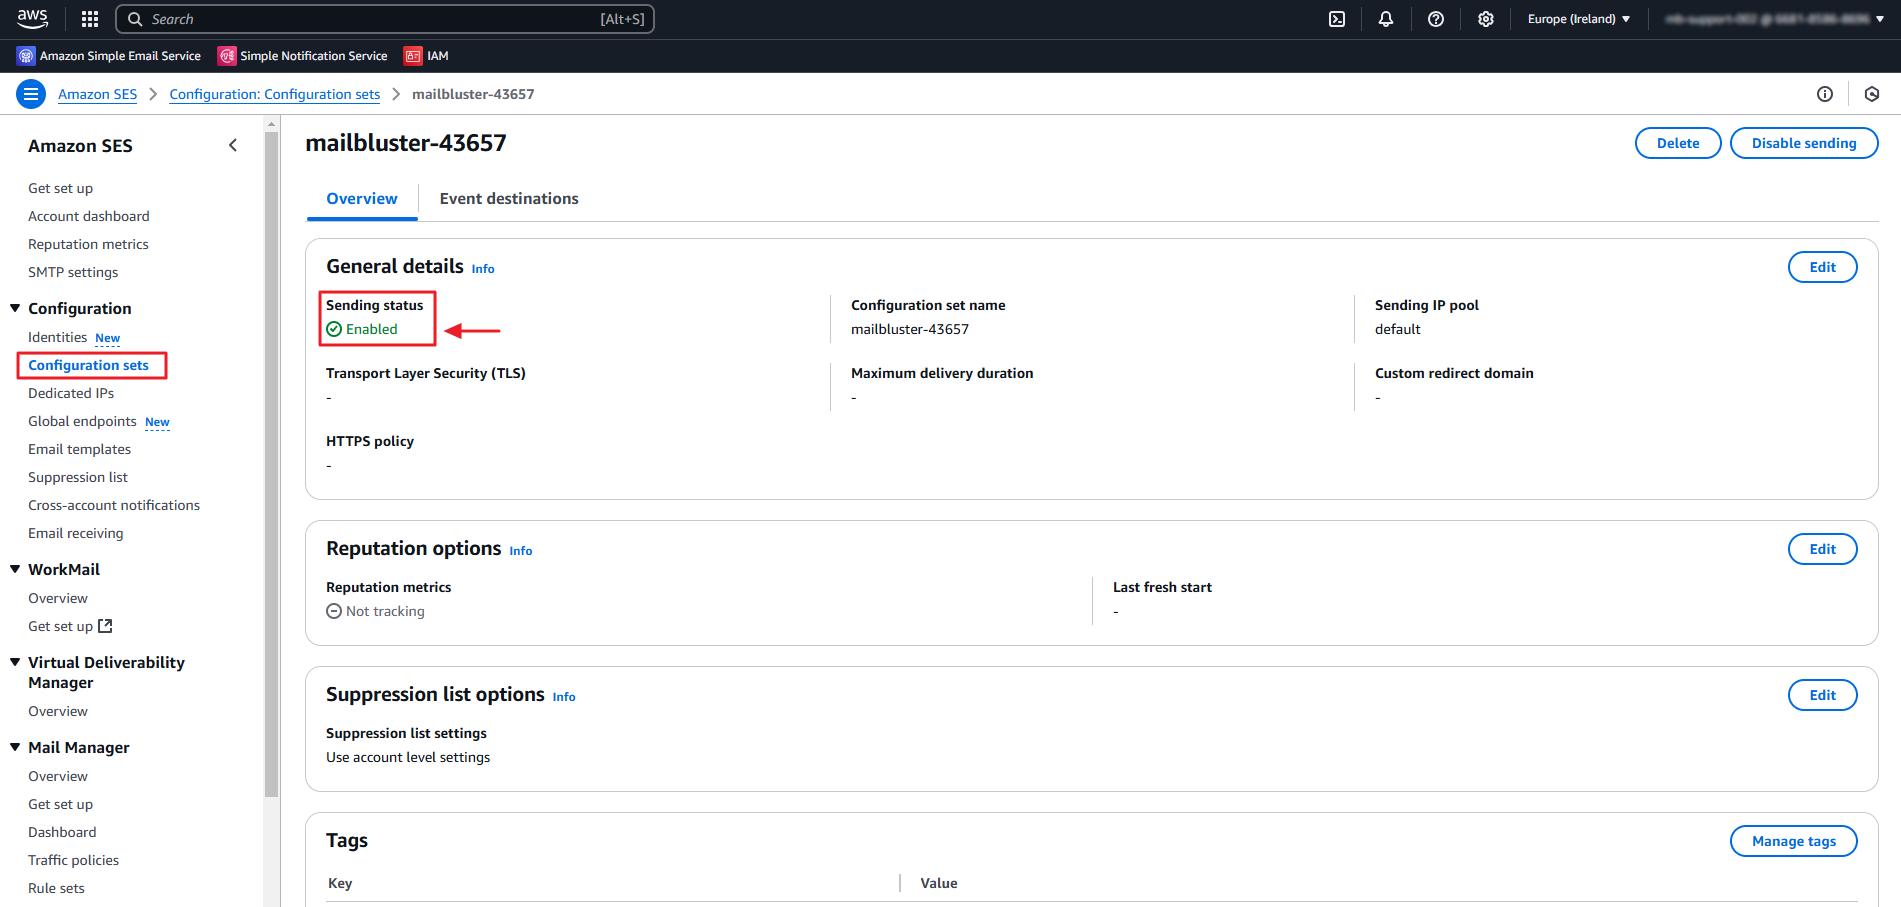
Make sure to set the ‘Sending status’ to Enabled under Configuration sets > Overview > General details.
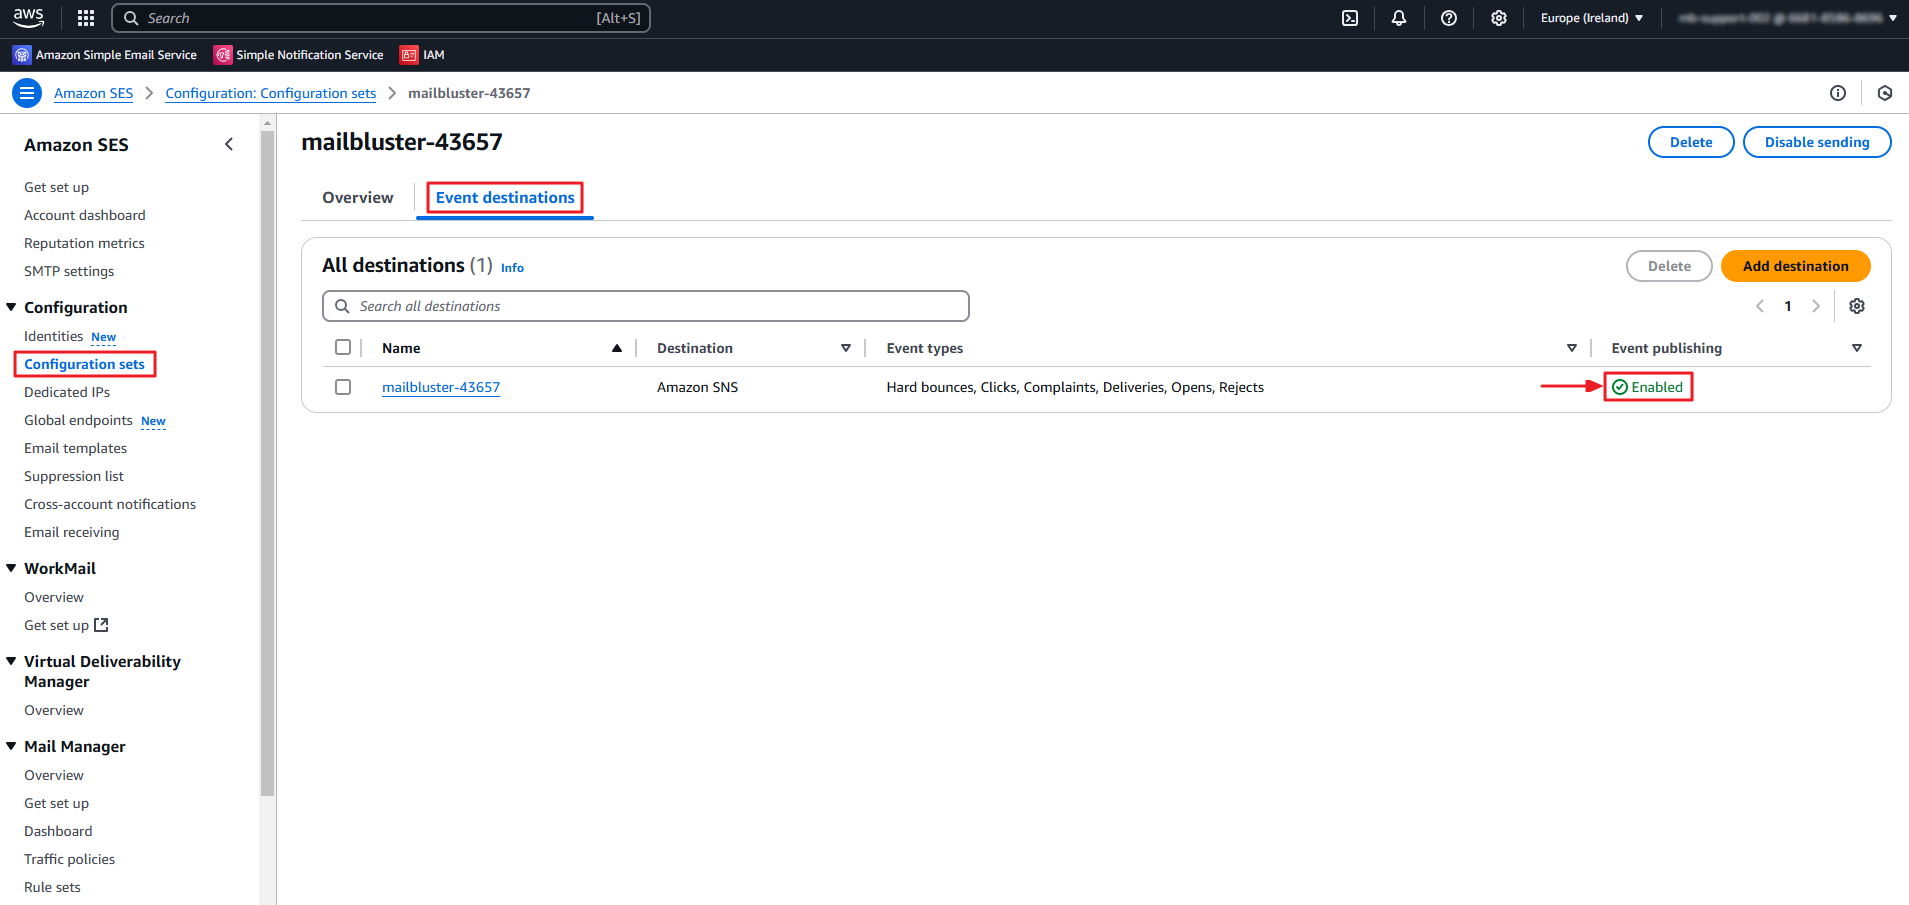
Now, click on ‘Event destinations’ and check whether the status of Event publishing is showing Enabled.
If this is set to Disabled, it indicates that your AWS account is missing some configurations that MailBluster creates. To resolve this, re-enter your AWS credentials in MailBluster by navigating to Brand > Settings > AWS and clicking the Save connection button. If successful, this will recreate the necessary configurations in your AWS account.
If you need guidance on generating AWS credentials properly, please follow this guide::Connect MailBluster With Your AWS Account. Ensure that you are signed in as an IAM User in AWS while performing this process..
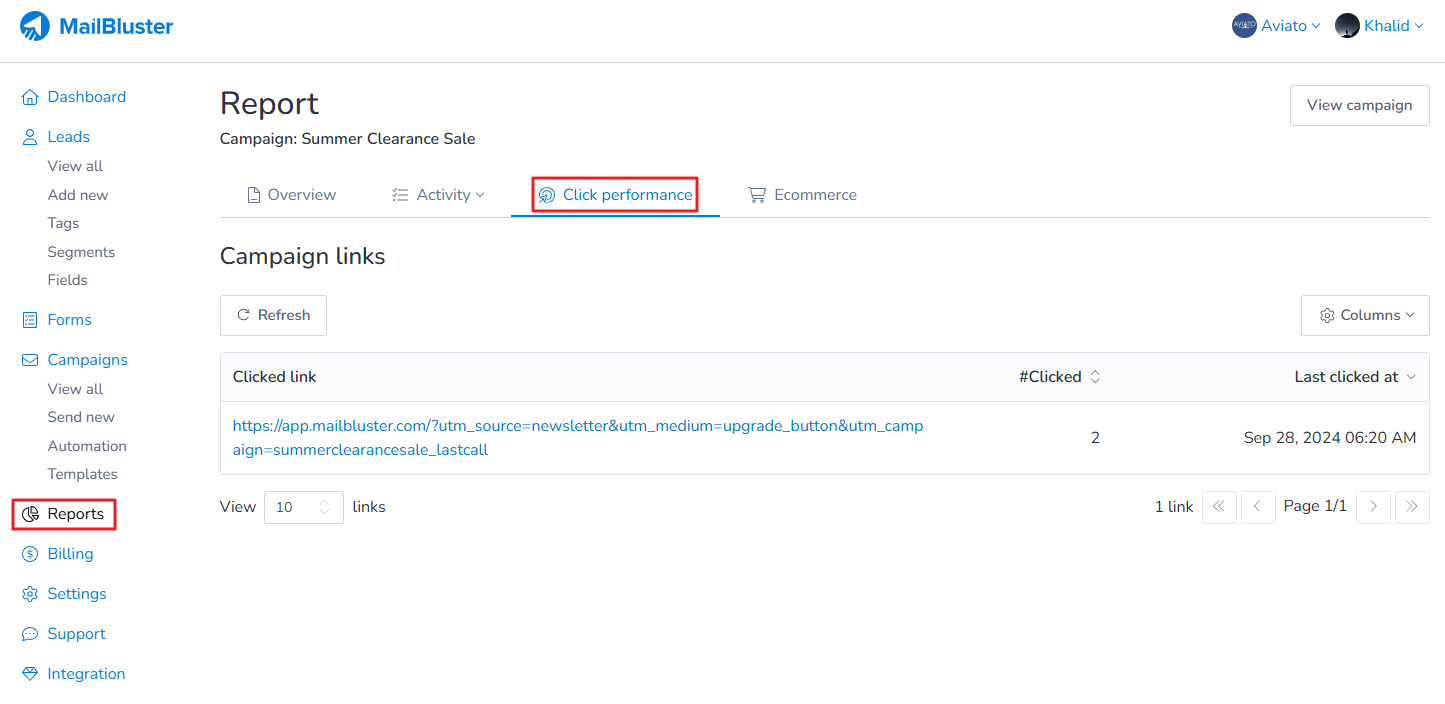
Click Performance in campaign report shows how recipients interact with links in your email campaigns. It tracks which links were clicked, how many times they were clicked, and by whom. By reviewing click performance in campaign reports, you can measure engagement, identify the strongest calls-to-action, and improve future campaigns.
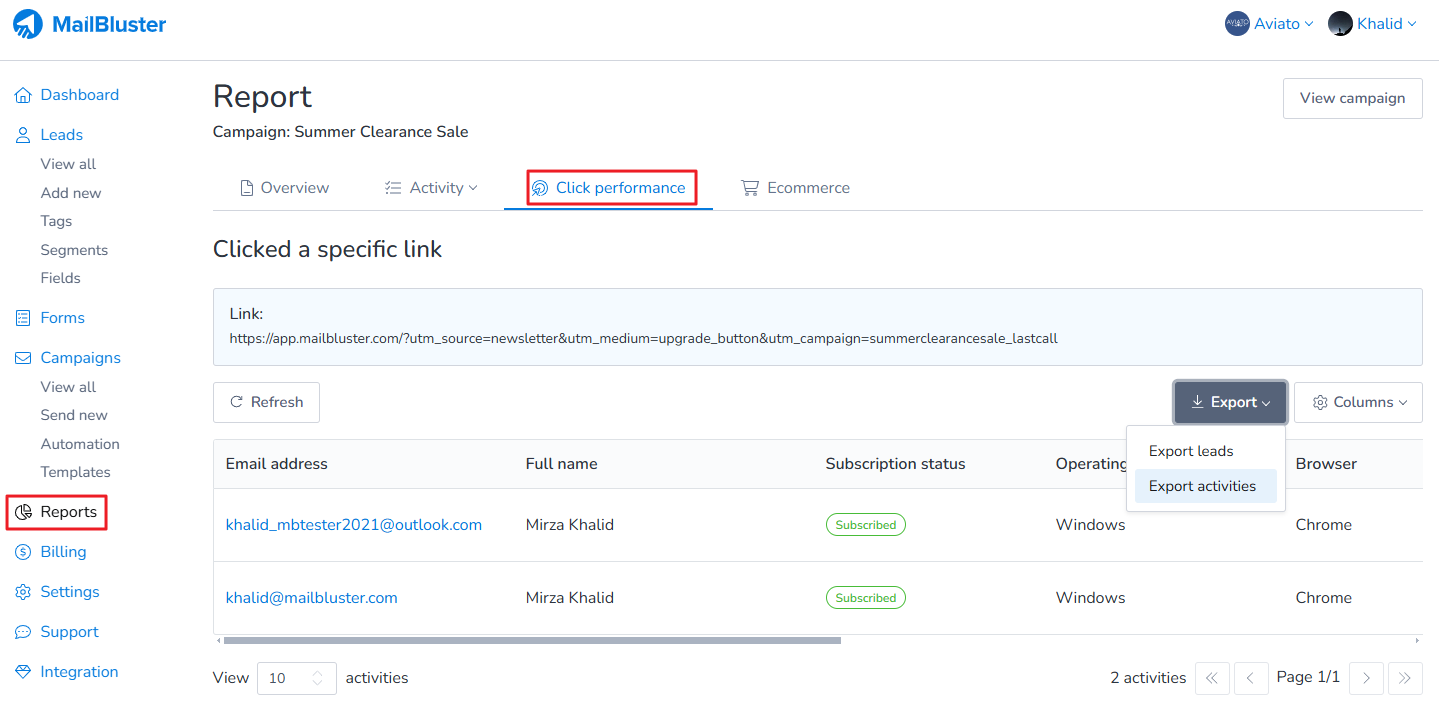
To check click performance in a campaign report in MailBluster, open the Reports section of your campaign. Then select the campaign details and click the Click Performance tab. This report gives clear insights into each link’s activity so you can understand user behavior and optimize your email strategy.
There is a report that shows who clicked in a campaign, and these reports can be exported.
If your bounce rate and complaint rate become high, it can seriously affect your email deliverability and even lead to the temporary suspension of your Amazon SES account. According to Amazon SES best practices, you should keep your bounce rate below 5% and complaint rate below 0.1% to maintain optimal email sending performance. Monitoring these metrics regularly is essential to ensure your campaigns reach your subscribers’ inboxes. Refer to this official AWS document: AWS Email Deliverability Dashboard.
When the bounce rate and complaint rate become high, it usually indicates issues with your email list, content, or sending practices. To manage these rates effectively:
Legal and Subscribed Recipients: The email addresses of your recipients should be legal, not purchased, and they need to be your domain’s subscribers.
Content Compliance: The content of your emails must follow AWS best sending practices. For a detailed list, refer to Email Marketing Best Practices.
To lower your bounce rate, clean up your email list using third-party email verification tools like Never Bounce, Zero Bounce, etc. These tools filter out bounced emails without sending real emails to them. A free tool called Super Email Validator is also available. For more information, refer to this: Clean Your Email List.
To remove bounced leads from your previous campaign, follow this guide: Remove Bounced Leads.
By cleaning your email list and following the above instructions, you should see improved deliverability for your marketing emails.
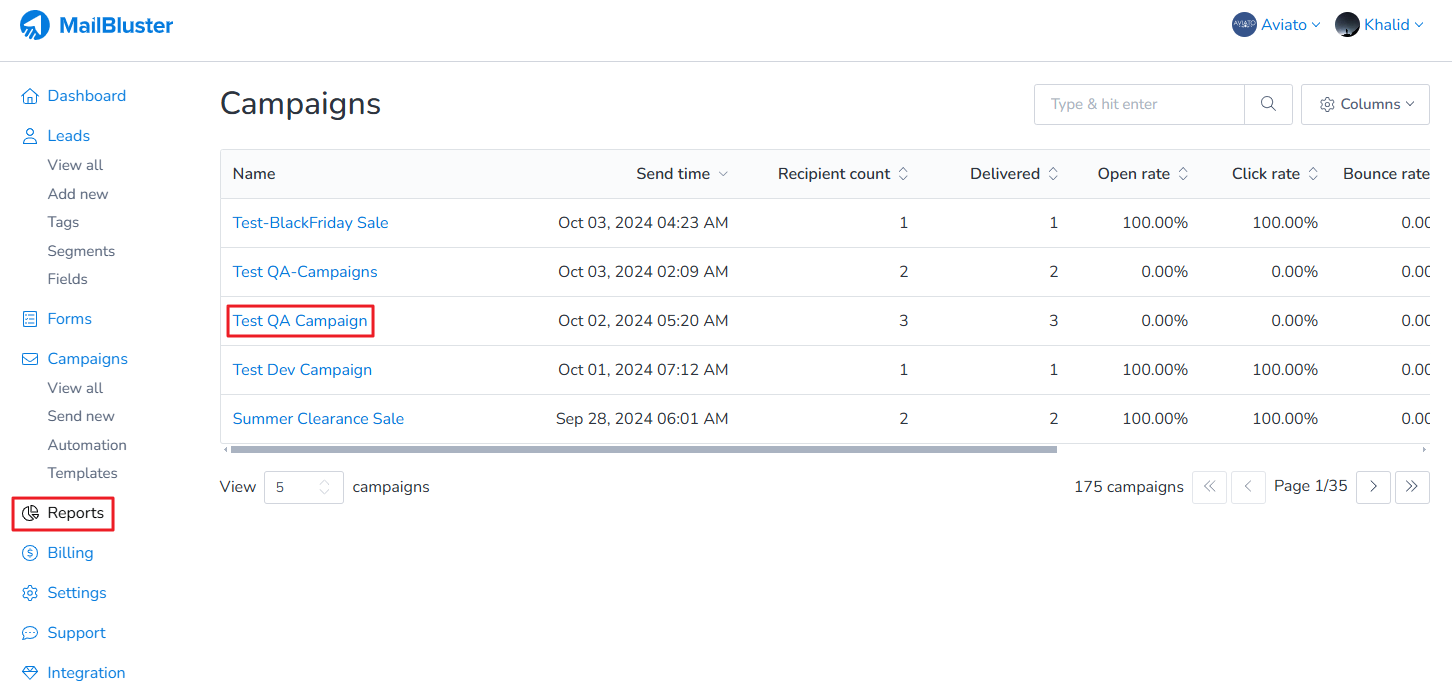
To view report for the campaign in MailBluster, start by navigating to your Brand > Reports section. Here, you will see a list of all campaigns for which reports are available. Select the campaign you want to analyze to access detailed metrics about its performance.
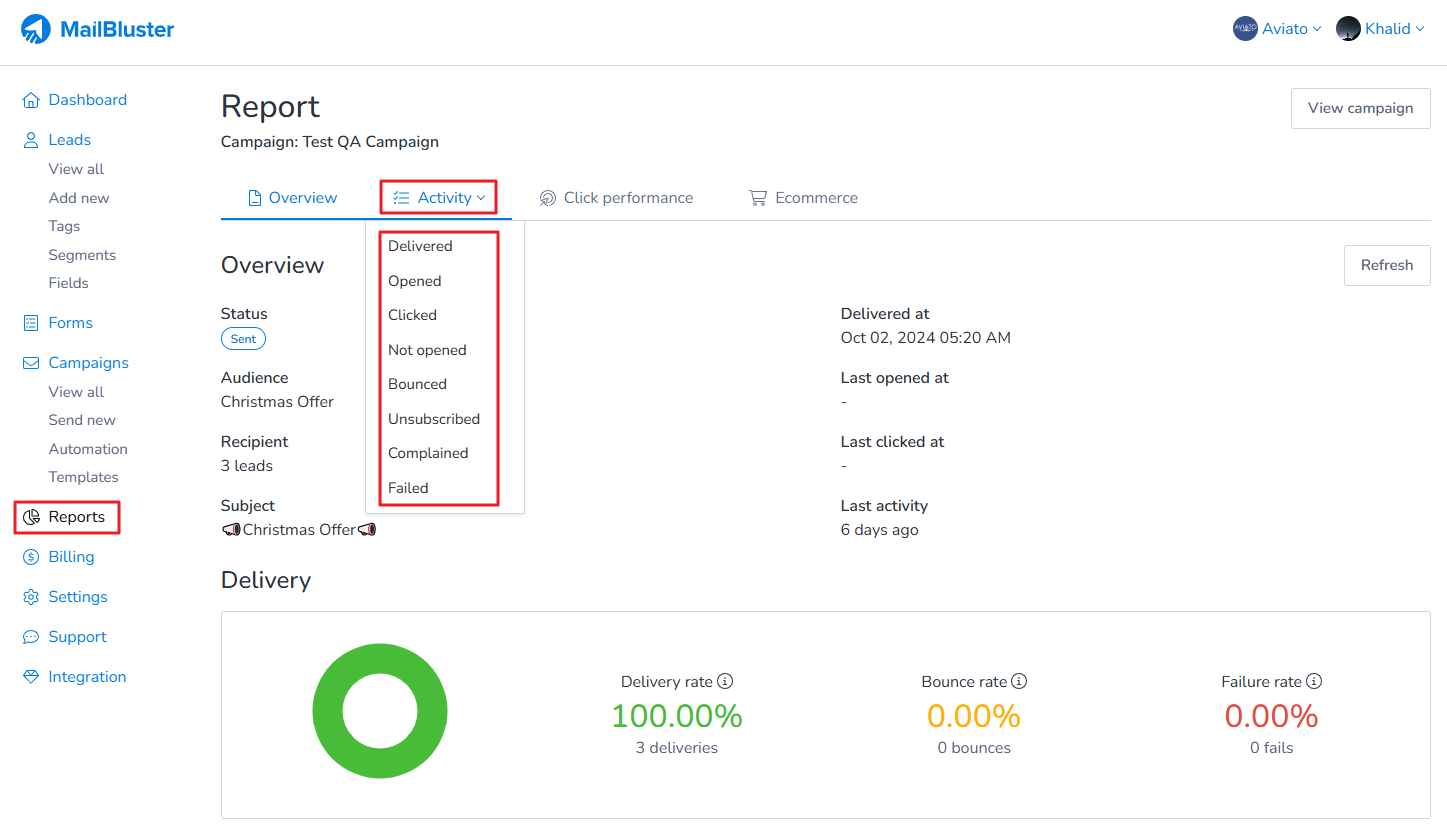
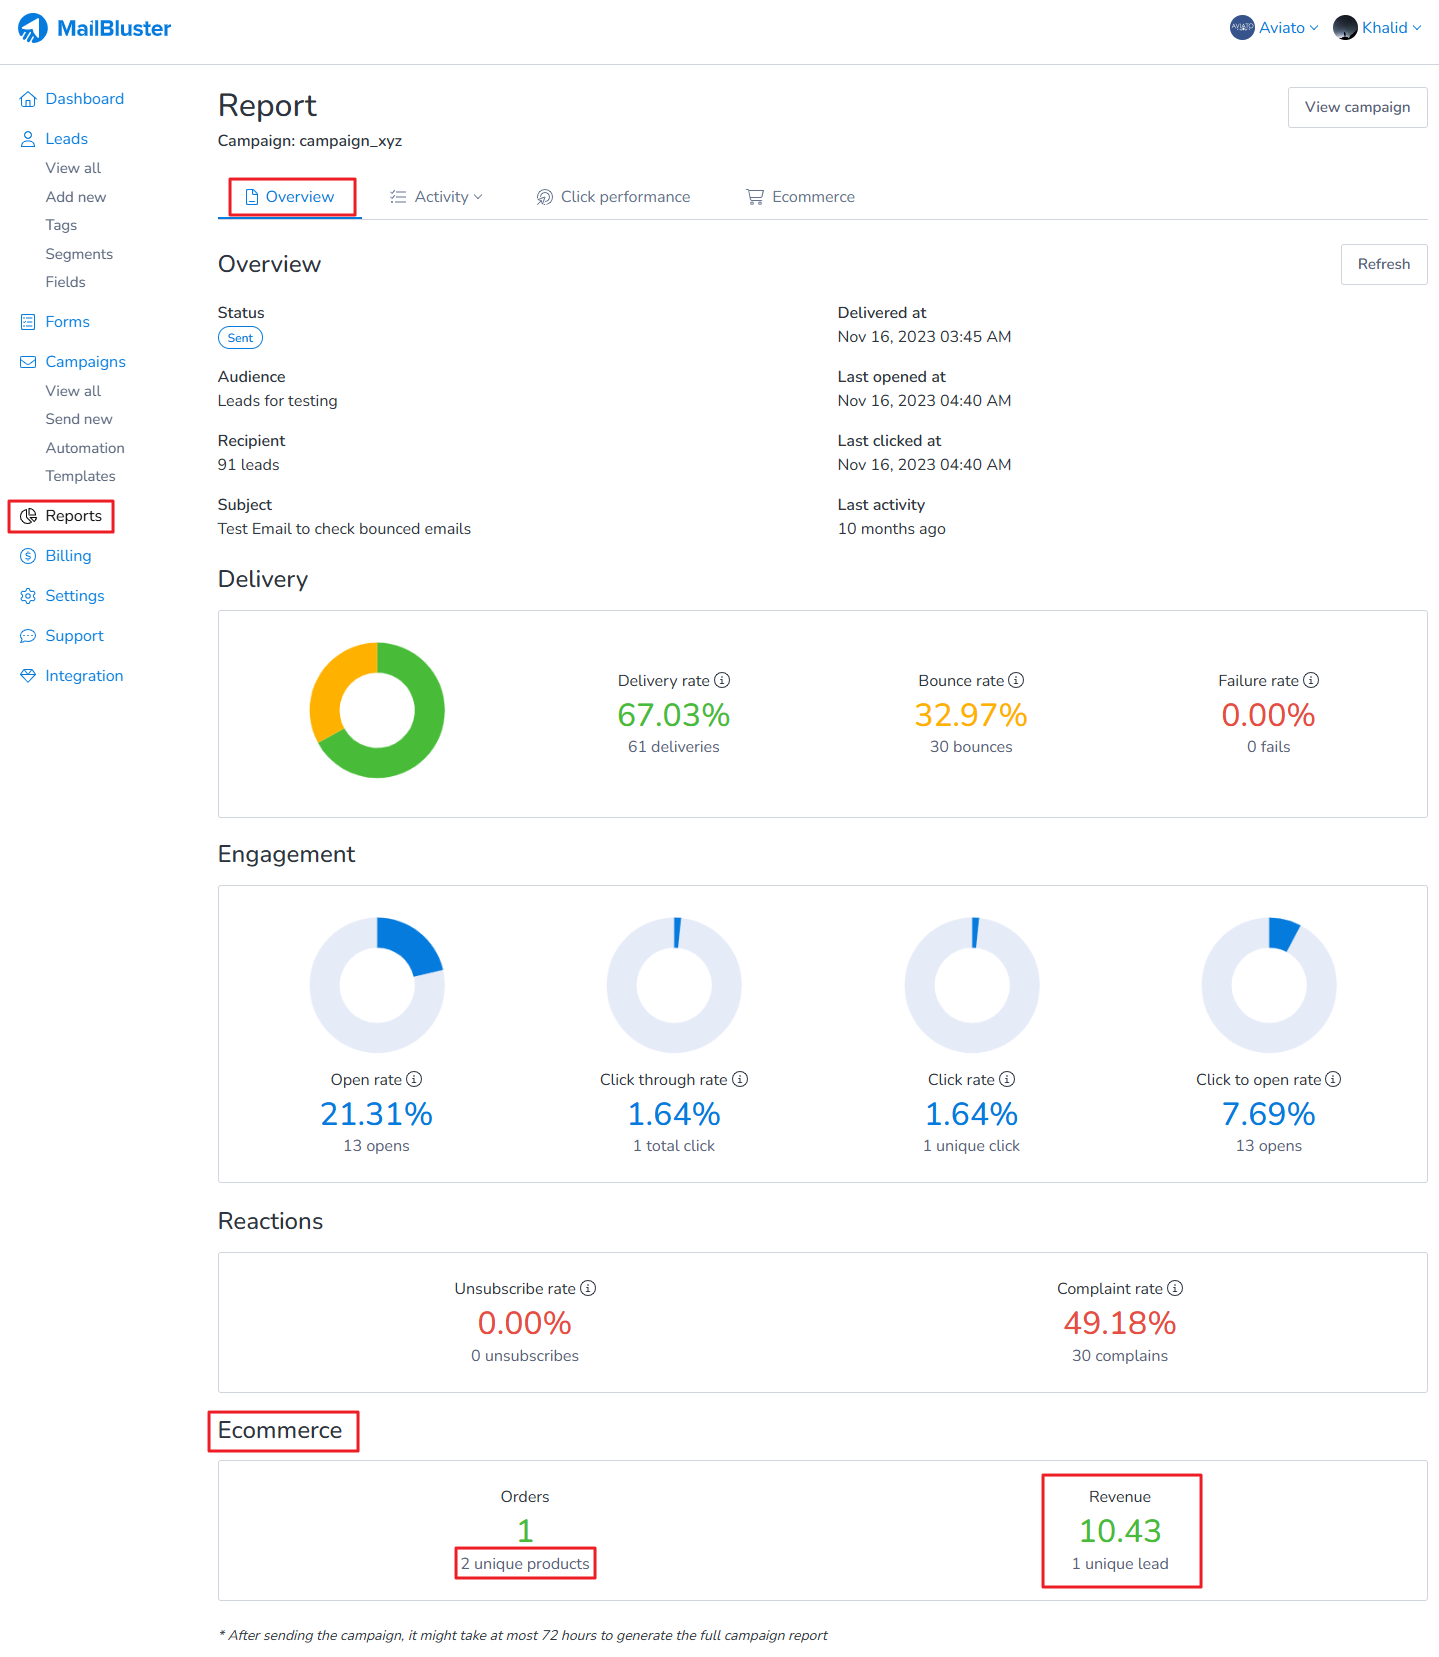
Once you open the detailed report, the first section you’ll see is the Overview. This summary provides a quick glance at key metrics, including Delivery, Engagement, Reactions, and Ecommerce performance. By reviewing the overview, you can quickly identify how well your campaign performed and spot trends that may need attention.
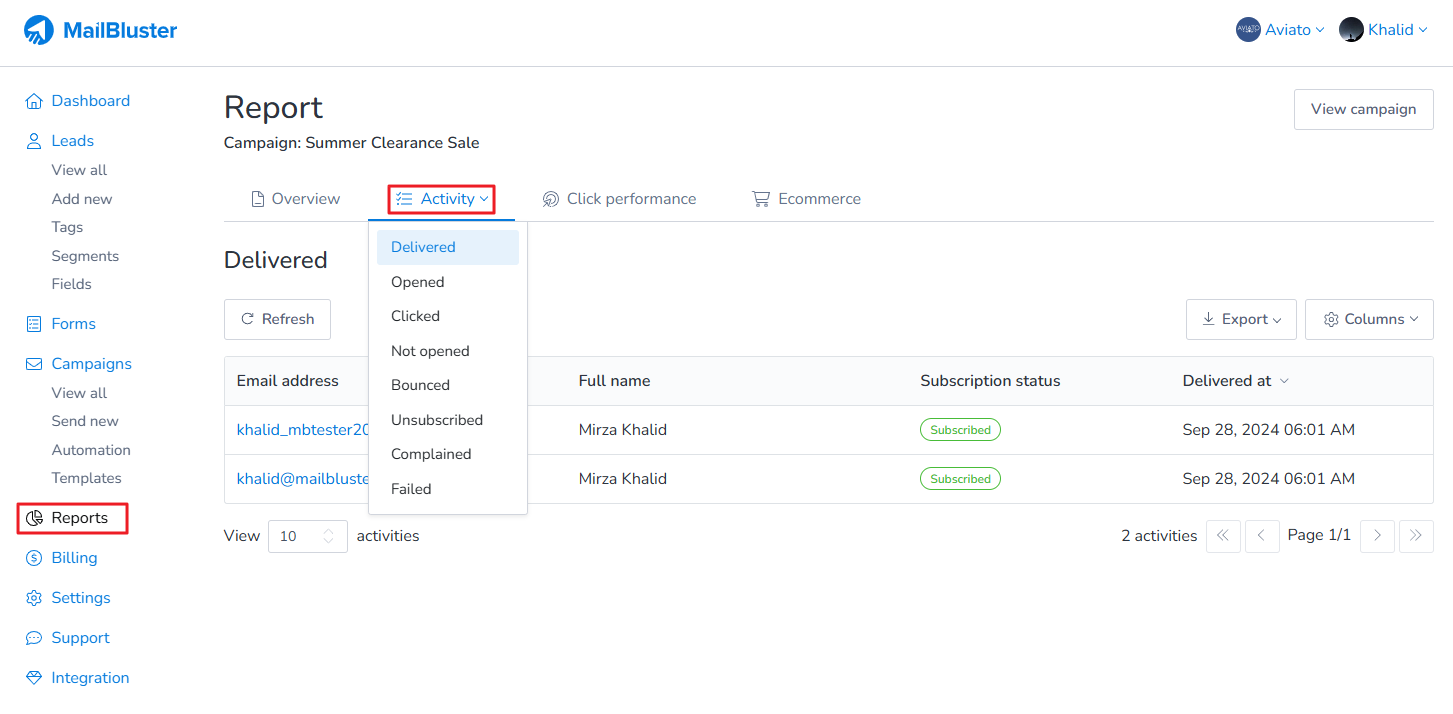
In the second tab, there is an option called Activity, where you can view details about each individual activity, such as Delivered, Opened, Clicked, Not Opened, Bounced, Unsubscribed, Complained, Failed Report. You can see information about which lead performed which activity and when.
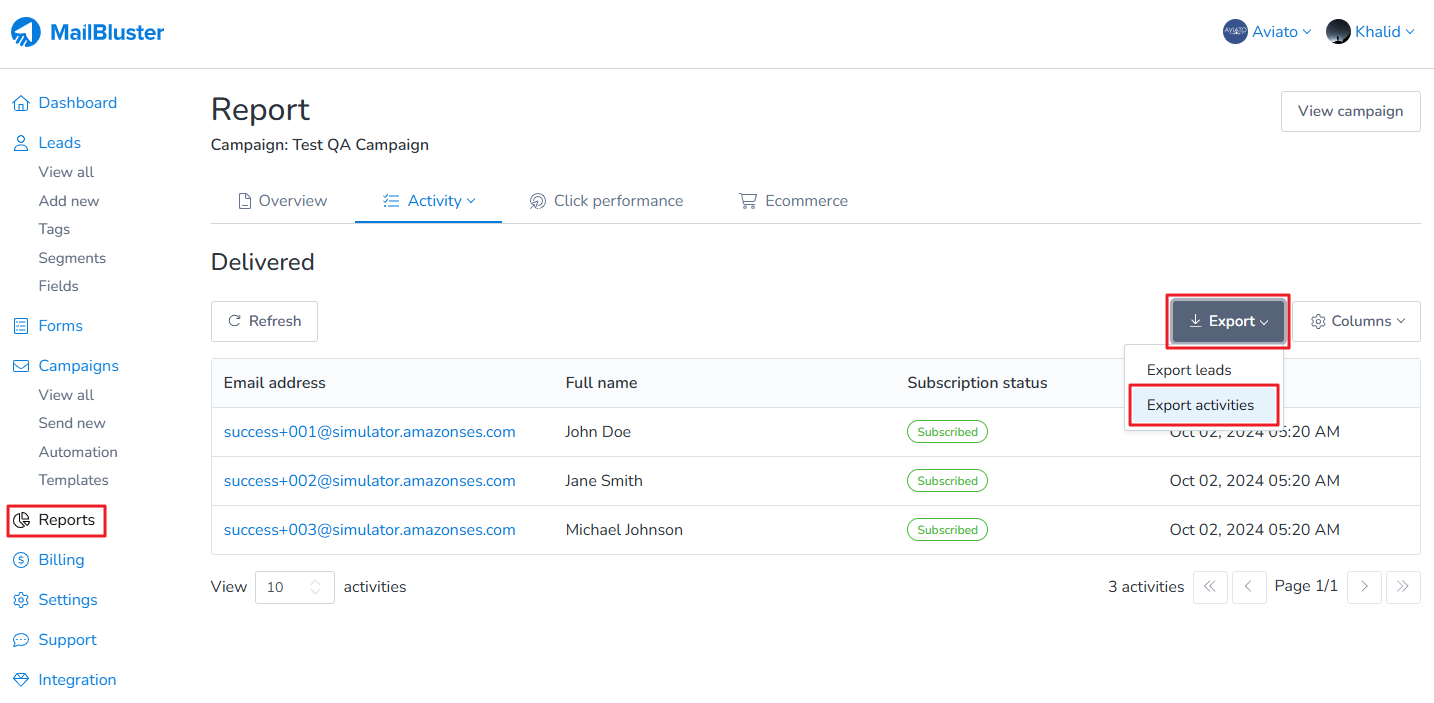
Additionally, you can export these activities if you wish. You can click on Export > Export leads or Export activities.
Click performance shows the performance of all the links in your campaign, including information on how many times each link was clicked and when they were clicked.
And the ecommerce report will contain a summarized version of the revenue or ecommerce data received from this campaign.
To export a campaign report in MailBluster, start by navigating to the Reports section of your Brand. Here, you will see a list of all your campaigns. Click on the name of the campaign you want to analyze, and you will be taken to its detailed report page.
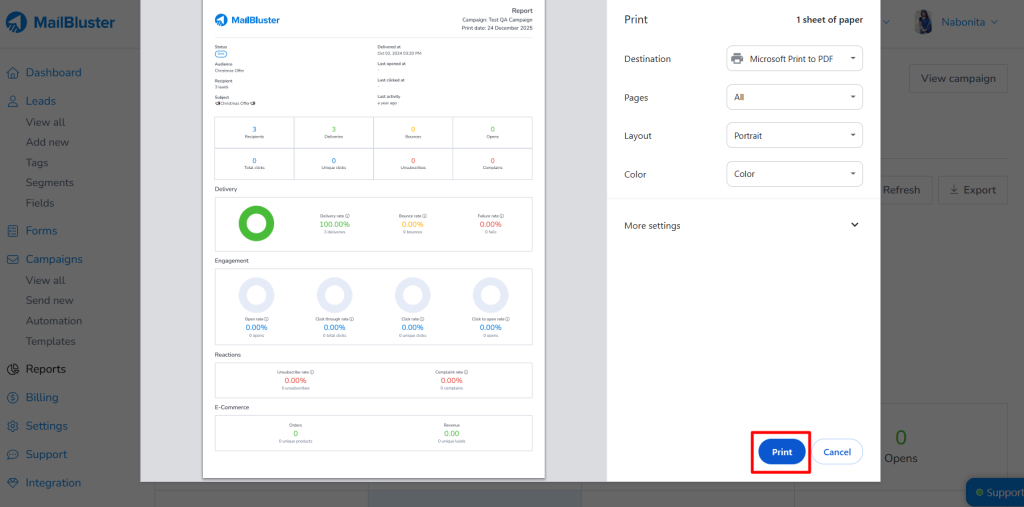
It will show the all the Report metrics of the campaign. Click on Export.
A pop-up window will appear. Click on Print
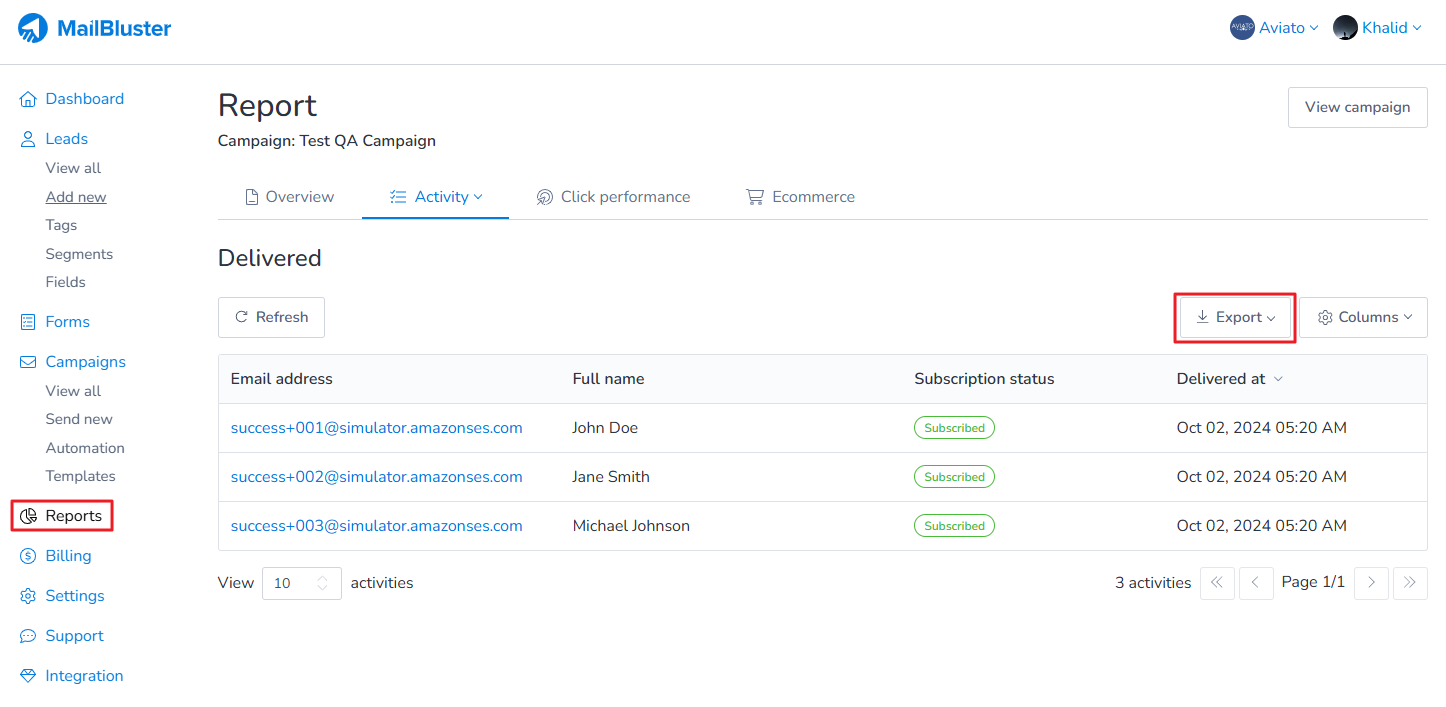
The detailed report includes key metrics such as Delivery, Engagement, Clicks, Reactions, and Ecommerce performance, providing a complete overview of how your campaign performed. Once you review the data, you can export the campaign report for offline analysis or for sharing with your team. Click on Activity and a list of report options will be available. Here we clicked on Delivered. You can select others as well from the list.
It will show the Report on successfully Delivered campaigns. Click on Export.
Click on Export activities to which will export all the details of Delivered.
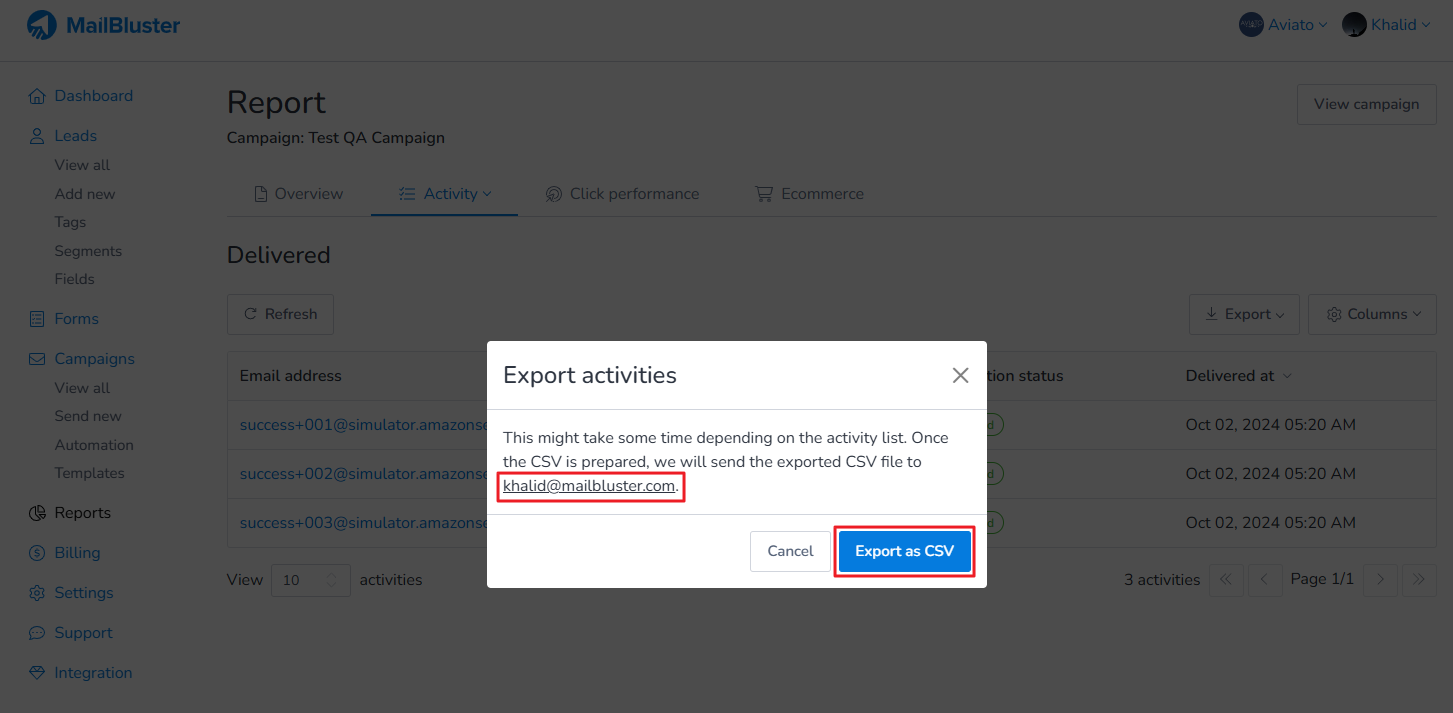
A pop-up window will appear with the header Export activities. It will show your email through which you will get the download link of the exported CSV file. Click on Export as CSV.
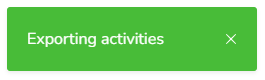
At bottom left screen, you will see a notification ‘Exporting activities’.
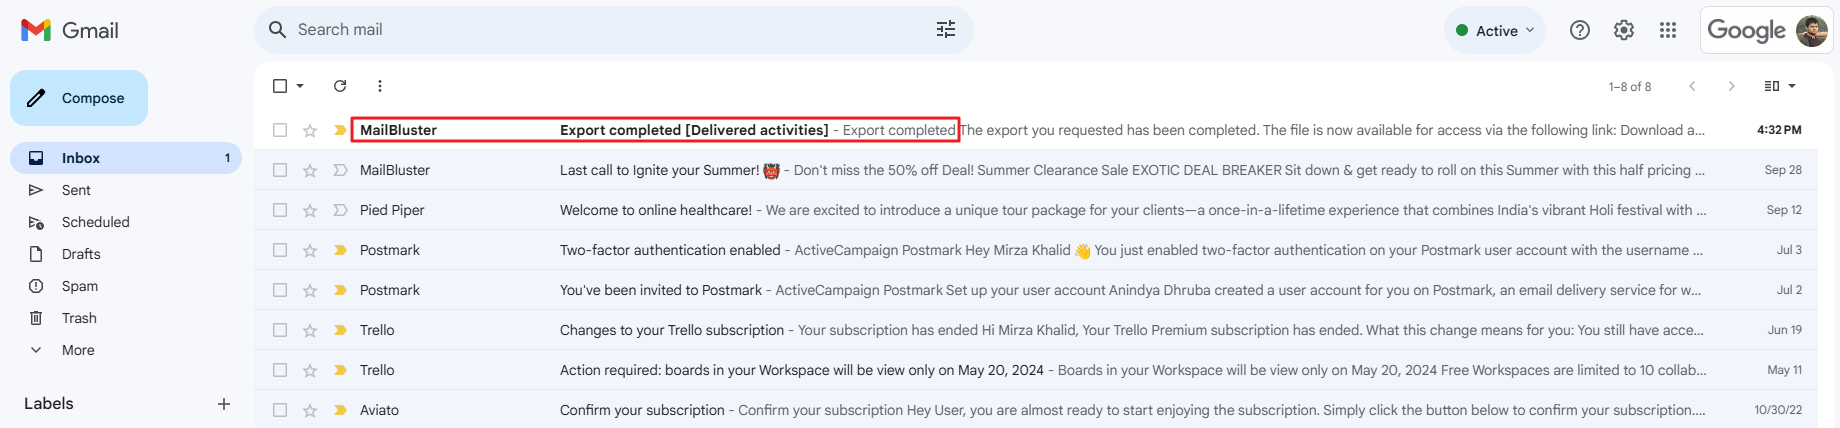
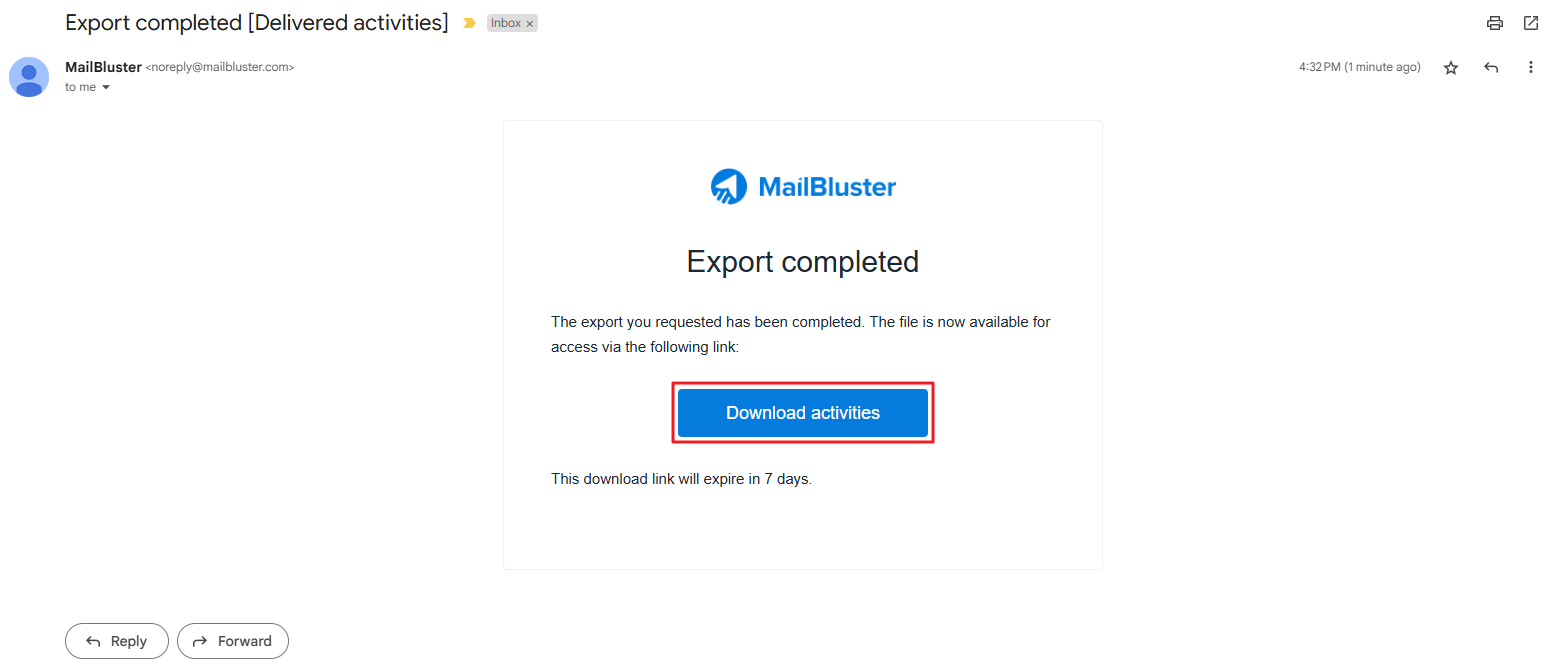
Then, you will receive an email from MailBluster notifying you that the Export is completed of Delivered activities.
Open the email and click Download activities.
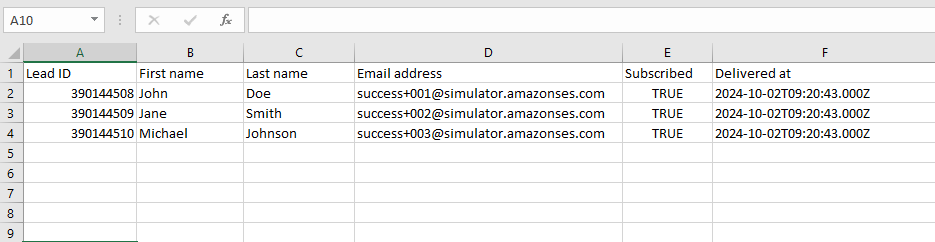
Extract the zip file and open the CSV file. You will see all the details of the Delivered activities.
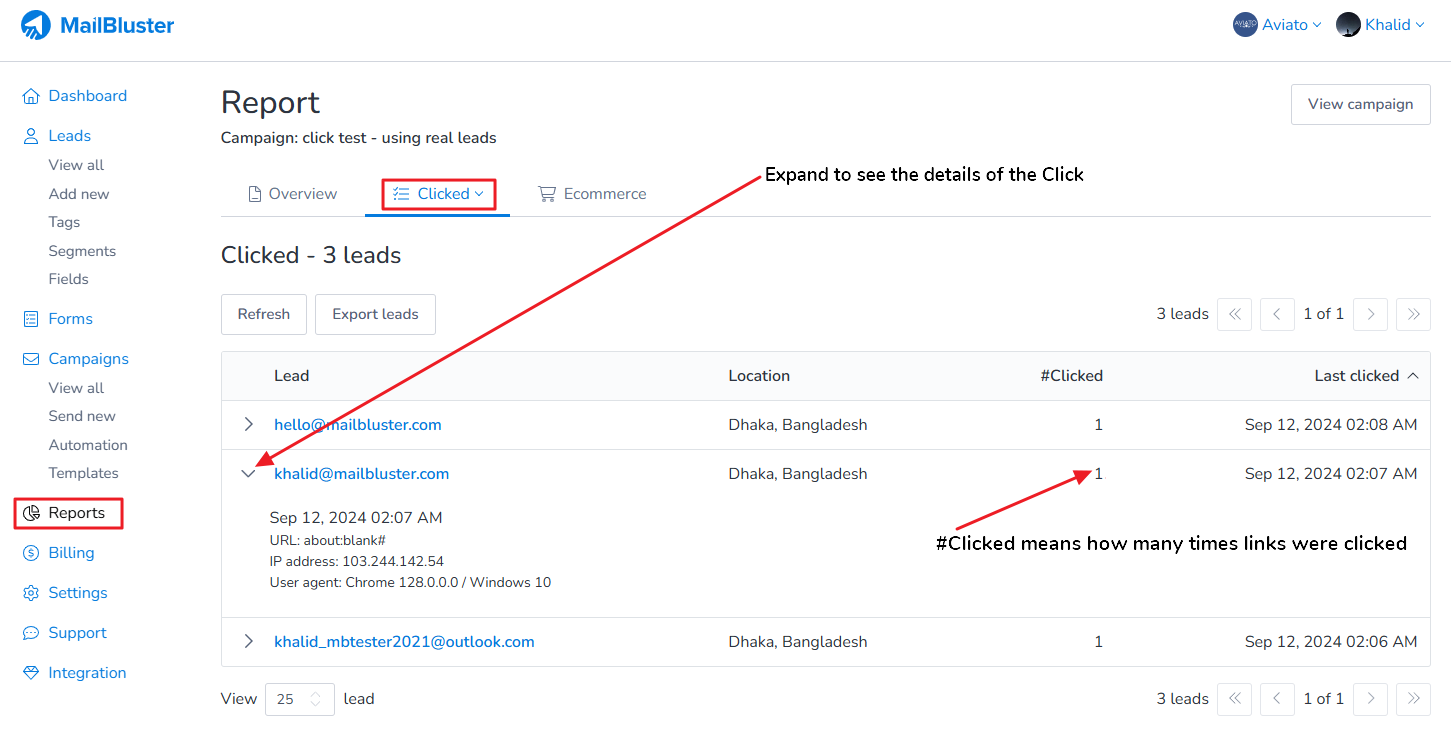
Here you will learn how to find who clicked on a link in your email campaign.
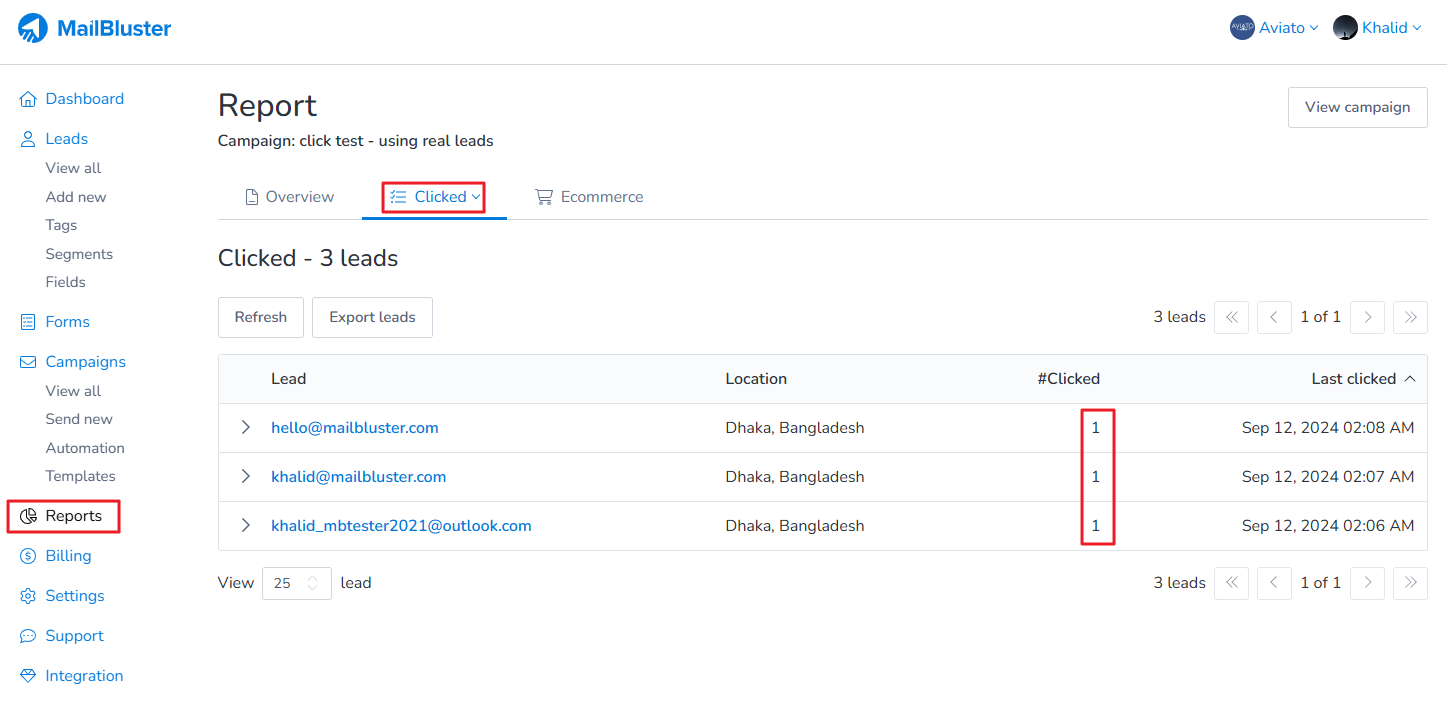
To start, open your campaign report and locate the Clicks section. Each number shows how many times a lead clicked a link. You can also see how many total clicks each link received.
To view details for a specific lead, click the right arrow button on the left side of that lead. This expands the view and shows all click events for that lead. By following these steps, you can easily find who clicked on a link and track engagement for your email campaigns. Please refer to the screenshot below for more information.
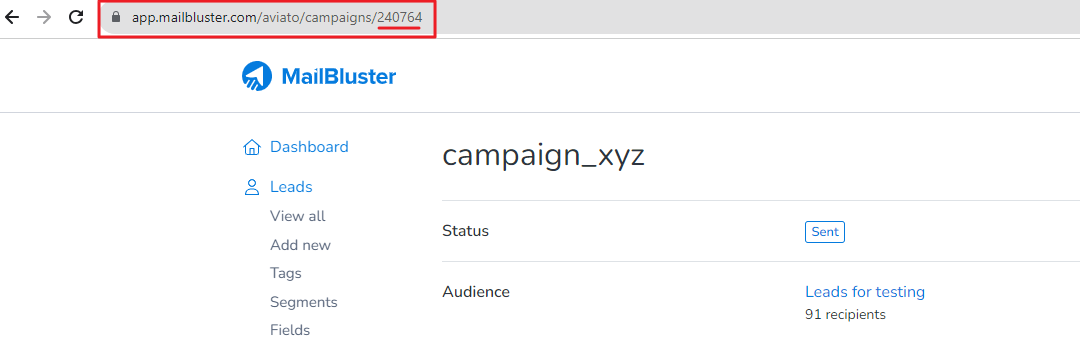
Here you will learn how to push payment data in report. You need to pass campaign ID at the time of creating order. You can use query parameters with a link for this purpose. When you create a campaign, you get a campaign ID which is shown in the screenshot. Then with this ID you can create a link like this: https://example.com/product/ball?c=12345 which will be placed into your campaign email. When an order is created, you get the value from URL and pass this query parameter value as campaign ID. When calling the Order API, send the Campaign ID. You will find all the details about Order API here: https://app.mailbluster.com/api-doc/orders
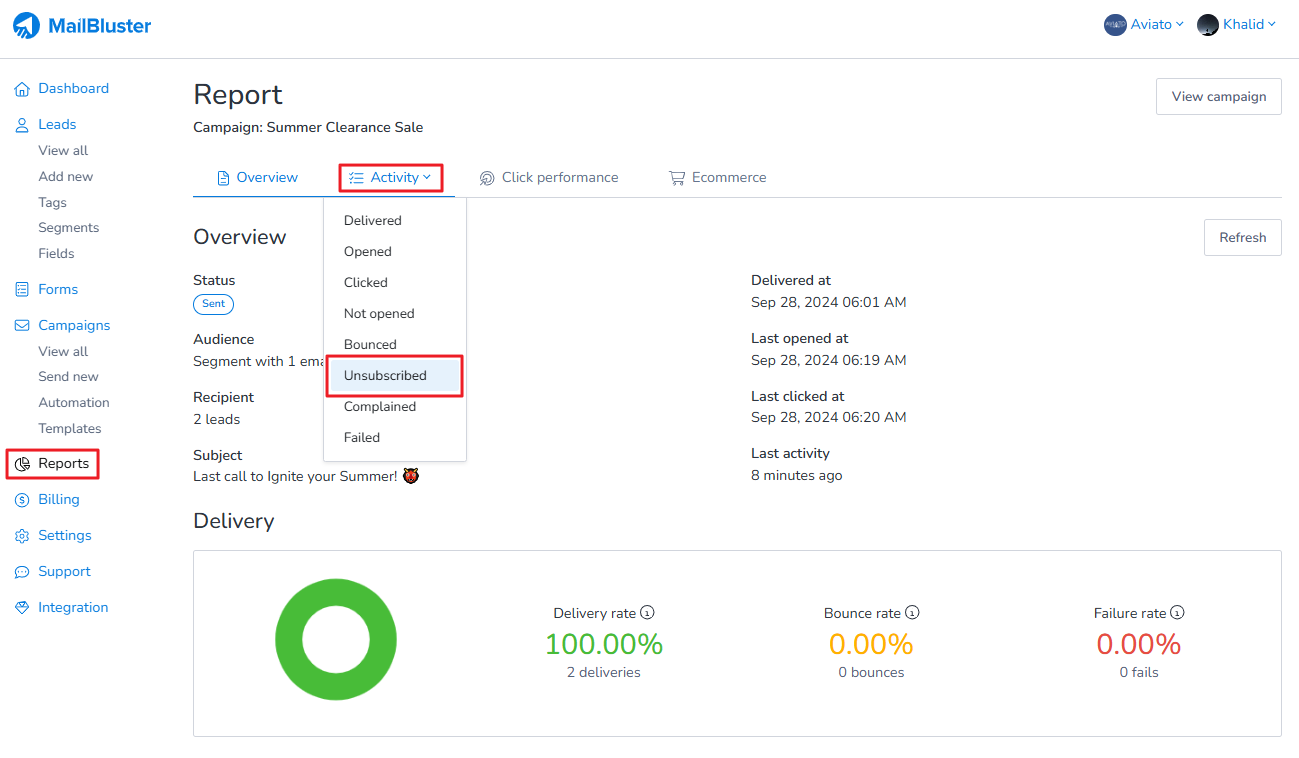
Learn how to track people who have unsubscribed from your email campaigns in MailBluster. Tracking unsubscribes helps you understand audience engagement, maintain a clean email list, and improve future campaigns. After sending a campaign, you can track how many people have unsubscribed by viewing the campaign report, as shown in the screenshot below.
Go to Activity > Unsubscribed to view the list of unsubscribed leads. When someone unsubscribes from your leads list, they won’t receive any future emails, even if you send another campaign. MailBluster automatically ensures that unsubscribed leads are excluded from all future campaigns.
Here you will notice who has unsubscribed from your current campaign as shown below.
Here, we briefly discuss why the open rate is higher than the click rate in some of your recent campaigns sent to subscribers.
We know that MailBluster uses Amazon SES along with Amazon SNS to track email events. When an open or click occurs, SNS sends the information to MailBluster, which then displays it. Essentially, AWS handles the tracking, while MailBluster stores and displays the data. – (This part needs Improvement and should be short)
However, email open rates are never completely accurate, not just for AWS but for all providers. Opens are tracked by embedding a transparent image in the email and tracking the URL of this image. Most ESPs (Email Service Providers) don’t display images by default, which prevents open tracking. Gmail, however, uses an image proxy server to protect user information and sometimes opens the email before the actual recipient does, causing a false open event.
Therefore, accurately tracking open events is impossible. This explanation is based on our observations and experience. It might not be 100% accurate, as Gmail and other services do not disclose their algorithms. Nonetheless, this seems to be the most logical explanation based on what we’ve observed.
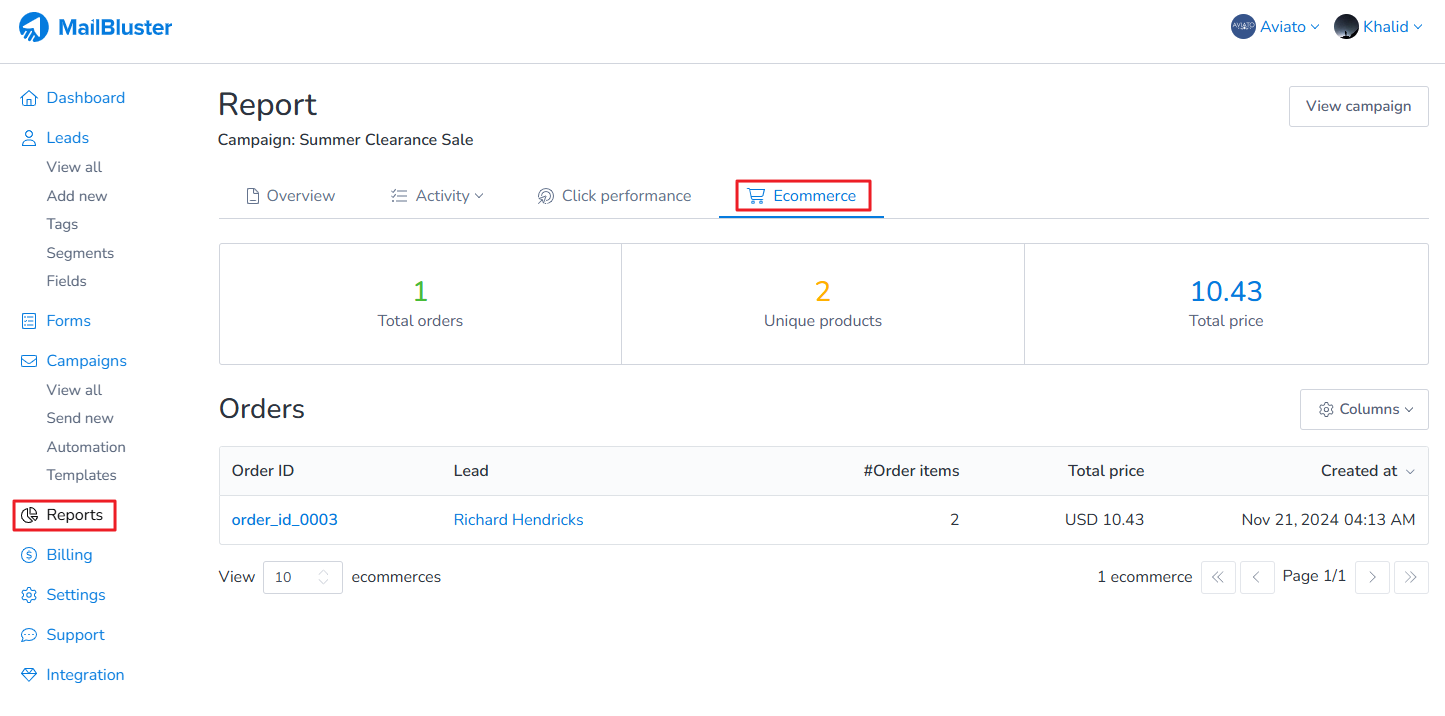
In MailBluster, you can view ecommerce report of a campaign to track orders, revenue, and customer activity. Knowing how toview ecommerce report of a campaign helps you measure campaign effectiveness and optimize marketing strategies.
MailBluster can generate an ecommerce report, but you need to provide the ecommerce data using the developer API. Learn details about Orders from Developer API.
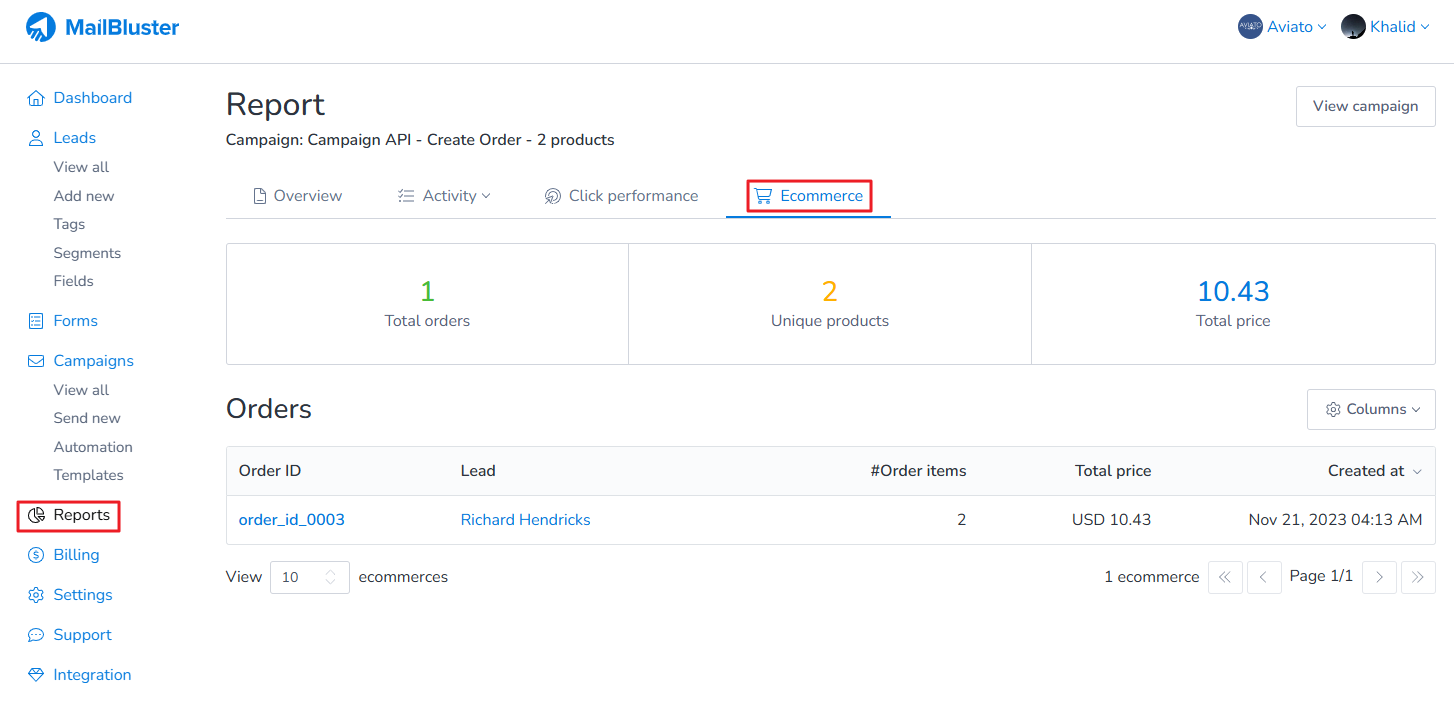
The following screenshot shares the overview of MailBluster ecommerce report:
The ecommerce tab here shows detailed information on how many orders have come from this campaign or how many products have been purchased. All this information is displayed in detail in this ecommerce tab.
And you can view each individual report by clicking on it. For example, I am viewing this report here.
Here, you will learn the difference between Orders and Revenue in Reports.
In Campaign Report, the Orders refers to the total number of unique products sold, while Revenue reflects the total income generated from the sale of those products under the campaign. The Orders and Revenue in Campaign Report is useful when you use MailBluster developer API for Products and Orders.
If you click on Ecommerce, you will see the Total orders and its Total price.
Here you will learn why sent emails don’t match total delivered bounced and unsubscribed in MailBluster reports. Many marketers notice differences between the number of emails sent and the final counts of delivered, bounced, or unsubscribed. This happens because of the way email servers handle delivery and reporting.
1.Permanent Bounce/ Hard bounce: This occurs when an email cannot be delivered due to an invalid email address or a non-existent domain. In such cases, the email server considers the bounce as permanent and won’t attempt further deliveries to that address.
2. Temporary Delivery Issue/Soft bounce: This might happen due to a full recipient mailbox, the recipient server being temporarily down, or other transient issues. In these cases, MailBluster retry sending the email after a certain period.
The rest of your emails might face temporary Delivery Issue/Soft bounce event.
When a soft bounce event happens, your SMTP provider continuously retries to deliver your email for 12 hours before giving up. There is no limit of retries during this 12-hour interval and as long as the ISP recovers, your email will be delivered.
In summary, when sent emails don’t match total delivered bounced and unsubscribed, it’s usually because of hard bounces, soft bounces, or unsubscribes after sending. Understanding these reasons helps you analyze reports more accurately and maintain a healthy email list. To reduce mismatches, clean your list regularly, verify email addresses, and avoid sending to invalid or risky contacts. Doing this improves deliverability and ensures that your reports better reflect reality.
Sometimes a campaign shows delivered but subscribers don’t receive the email. This can happen even when your email service reports successful delivery. Understanding why this occurs helps ensure better deliverability and accurate campaign tracking.
One common reason is that subscribers use strict security settings, such as .edu or .gov domains. These security systems often preload links and images in your email to check for spam or malicious content. As a result, the campaign may show as delivered or even “opened,” but the subscriber never actually sees it.
You can verify this behavior by inserting a hidden link in your campaign. If the link registers a click without the recipient opening the email, it indicates the spam filter triggered automatic activity.
If your audience frequently uses strict domains (such as .edu, .gov, etc.), we recommend asking them to provide their personal email addresses when they subscribe for newsletter/email campaign. If you use online forms to collect subscribers, you could add text suggesting that subscribers use their personal email addresses instead of their business email addresses.
To report email abuse in email campaign, such as spam, phishing, or other malicious activity, you can follow these steps:
1. Identify the Email Provider:
Check the domain of the sender’s email address (the part after the “@” symbol) to determine which email service provider they use (e.g., Gmail, Yahoo, Outlook).
2. Report to the Email Provider:
Gmail:
Open the email and click the three vertical dots in the top-right corner.
Select “Report phishing” or “Report spam.”
Yahoo:
Open the email and click the three horizontal dots in the top-right corner.
Select “Report phishing” or “Report spam.”
Outlook:
Open the email and click the “Junk” button in the toolbar.